A maintenance manager usually gets introduced to vibration analysis tools the hard way. A production line is running full, a critical pump or fan starts making trouble, and by the time operators hear the change, the repair is already expensive and the outage is already real. The equipment didn't fail without warning. The plant just didn't capture the warning in a form the team could act on.
That's the purpose of vibration analysis tools. They turn machine motion into usable maintenance information before a breakdown forces the schedule. On a process water pump, that might mean catching bearing damage early enough to plan a replacement. On a kiln fan, it might mean spotting imbalance before it starts eating bearings, couplings, and structural supports. On a VFD-driven motor, it might mean separating a true defect from a normal load change so the team doesn't chase ghosts.
Table of Contents
- From Unplanned Downtime to Predictive Control
- The Complete Vibration Analysis Toolkit
- Matching Diagnostic Techniques to Specific Failure Modes
- Choosing Between Route-Based and Continuous Monitoring
- Best Practices for Ensuring High-Quality Data
- An Analyst's Workflow for Interpreting Vibration Data
- Your Implementation and ROI Checklist
From Unplanned Downtime to Predictive Control
A familiar example is a food plant booster pump that runs without issue for months, then fails during a peak shift change. Operators report noise only after the machine is already hot, maintenance finds metal in the bearing housing, and production loses time while the team scrambles for parts. That sequence is common in plants that still rely on calendar work and operator feel alone.
The better path is predictive control. Instead of waiting for visible damage, the team measures how the machine behaves and watches for change. That's where vibration analysis tools moved the industry forward, especially once the Fast Fourier Transform, or FFT, became practical for maintenance work. A history of vibration measurement in predictive maintenance notes that the first commercially available FFT system appeared in 1967, and by 1984 Palomar Technology International had introduced the first handheld data collector with an internal FFT analyzer. That shift is what turned vibration work from skilled observation into repeatable, data-driven condition monitoring.
A new maintenance manager doesn't need nostalgia. The practical takeaway is simpler. FFT converts a raw time signal into a frequency spectrum, and that spectrum makes common faults easier to separate. Imbalance, misalignment, looseness, and bearing defects don't all look the same when the data is organized by frequency.
A plant doesn't gain control when it buys instruments. It gains control when it can see defect growth early enough to plan the repair window.
That's the dividing line between reactive maintenance and a mature reliability program. Teams that are still sorting out the bigger strategy often benefit from understanding the difference between predictive vs preventive maintenance, because vibration analysis only pays off when the organization is ready to act on condition data.
The Complete Vibration Analysis Toolkit
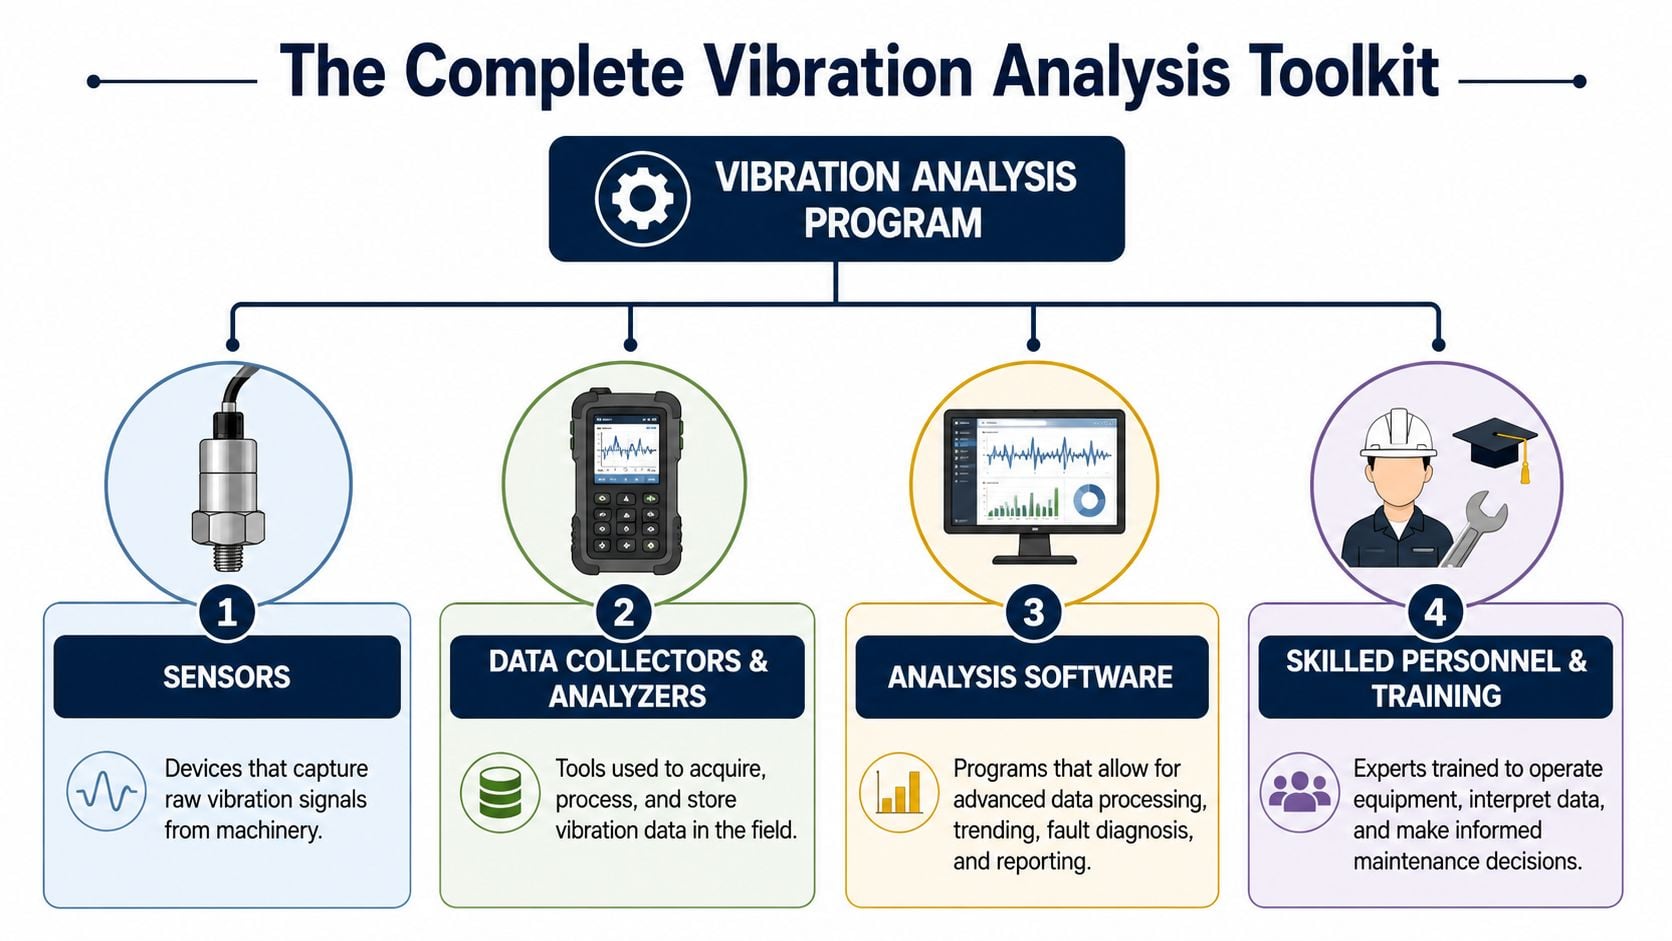
A vibration program is never just one device. It's a chain. If one part is weak, the whole diagnosis gets shaky.
Sensors that hear what operators can't
The front end is the sensor. Industrial vibration work commonly uses accelerometers, piezovelocity sensors, and moving-coil sensors as seismic transducers. A practical overview of vibration and dynamic measurements explains that modern vibration analysis is built on sensors, signal processing, and trend analysis, typically starting with a baseline, then measurement of amplitude, then FFT comparison against normal machine behavior.
For most general plant work on pumps, motors, compressors, and gearboxes, the sensor is the machine's ear. But the sensor only works if it's mounted at the right location and applied consistently. On a motor-pump train, for example, a reading near the inboard motor bearing tells a different story than a reading taken on a thin guard or a painted foot.
Collection, analysis, and people
The second piece is the data collector or analyzer. This is what the technician carries on route work or what the permanently installed system uses to capture and process the signal. Good collectors do more than store readings. They enforce route discipline, preserve measurement points, and let the team compare like-for-like data over time.
The third piece is analysis software. That's where trends, spectra, alarms, notes, and maintenance history come together. Without software, plants collect readings. With software, they build evidence.
The fourth piece is the one most plants underestimate. Skilled personnel and training. The tool doesn't diagnose the machine by itself. A spectrum still has to be interpreted in context. A high reading on a cement conveyor drive might be imbalance, looseness, poor mounting, or process variation. Someone has to sort out which one is most likely before work gets planned.
A practical toolkit usually includes:
- Portable route tools: Best when a technician can visit many assets on a set schedule and gather structured data.
- Permanently mounted sensors: Best when the asset is critical, remote, hazardous, or prone to fast-moving failure.
- Diagnostic software: Needed for trending, alarm review, and turning findings into maintenance action.
- People who know the machine: Operators, planners, mechanics, and analysts all contribute pieces of the diagnosis.
One option plants use for this kind of program is vibration monitoring services from Forge Reliability, especially when the site needs both route-based and continuous coverage tied to reliability decisions instead of isolated readings.
Practical rule: If the plant can't explain who reviews alarms, who confirms findings, and who turns them into work orders, it doesn't have a vibration program. It has hardware.
Matching Diagnostic Techniques to Specific Failure Modes
The fastest way to waste vibration data is to grab one measurement type and expect it to answer every question. It won't. Different faults show up in different parts of the signal.
Choose the parameter before chasing the fault
The measurement parameter matters as much as the instrument. A guide to choosing the correct vibration parameter notes that acceleration is best for high-frequency faults like bearing defects, displacement works best for low-frequency issues like structural looseness, and velocity RMS is often the strongest overall severity indicator across roughly 10 to 10,000 Hz.
That matters in the field. On a paper mill fan, early bearing damage may barely move the overall velocity, but high-frequency acceleration starts to change. On a soft-foot motor base, displacement and low-frequency behavior often tell the story faster than a high-frequency view will.
Problem, signal, and tool
A practical analyst reads vibration in the order of likely failure modes.
| Failure Mode | Typical Vibration Signature | Primary Diagnostic Technique |
|---|---|---|
| Imbalance | Dominant running-speed component, usually clean and repeatable | FFT spectrum with amplitude trend |
| Misalignment | Running-speed energy with harmonics, often strong axial response | FFT plus phase analysis |
| Mechanical looseness | Multiple harmonics, unstable pattern, elevated noise floor | FFT plus time waveform |
| Bearing defect | High-frequency content, impact-related activity, early subtle changes | Acceleration-based analysis and bearing-focused diagnostics |
| Resonance | Large response tied to structure and operating condition | Bump test and operating-state review |
| Rubbing or impacting | Non-sinusoidal waveform, intermittent events | Time waveform analysis |
A few field examples make the point clearer:
- Large process fan imbalance: The classic clue is a strong running-speed response. The fix is rarely just balancing weights. The team should first check for buildup, damaged blades, or process contamination causing the imbalance.
- Pump and motor misalignment: A coupling issue often creates running-speed energy with harmonics. The technician shouldn't stop at “alignment problem.” The next questions are whether the base moved, pipe strain changed, or the machine was aligned cold and is running hot.
- Bearing defects: These usually show up earlier in the high-frequency range. That's why bearing work depends so heavily on the right parameter and clean data. Plants looking deeper into that area often use a more focused bearing fault detection approach in vibration analysis.
- Structural looseness and resonance: These are where less experienced teams lose time. They replace bearings because the vibration is high, but the cause is a weak base, cracked support, or natural frequency problem in the structure.
If the pattern doesn't stay consistent from reading to reading, the team should question the machine condition, the mounting method, or both.
The “so what” is simple. Don't ask one tool to solve every fault. Match the parameter and diagnostic method to the failure mode, or the plant will get noise instead of answers.
Choosing Between Route-Based and Continuous Monitoring
Plants often make this decision backward. They start with the technology, then look for a reason to install it. The right approach starts with the asset.
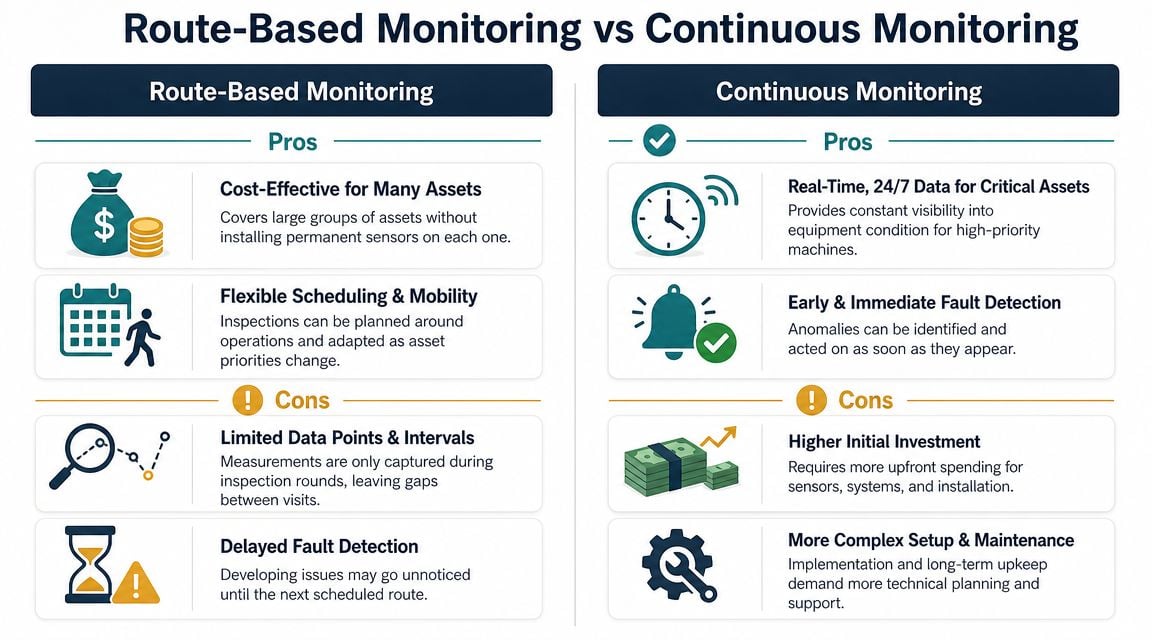
A discussion of vibration analysis for predictive maintenance points out a common challenge: deciding which assets justify continuous monitoring versus periodic routes. It also makes an important point that many plants learn late. More data isn't automatically better. Continuous monitoring on low-criticality assets can increase alarm fatigue and review burden without giving the plant a matching reliability benefit.
When route-based monitoring is enough
Route-based monitoring works well when the machine has a manageable failure development period, the asset is accessible, and the consequence of failure is limited or buffered by redundancy.
Good route candidates often include:
- Redundant pumps: If one standby unit can carry the load and technicians can access both assets safely, periodic route collection is usually enough.
- General utility motors: If speed and load are stable and failure won't stop the process immediately, a route can provide enough warning.
- Non-critical gearboxes: If repair planning is straightforward and the machine is easy to inspect, there's little reason to create a permanent data stream.
A monthly or more frequent route might be the right answer, but only if the route is disciplined. Missed points, skipped assets, and long upload delays ruin the value.
When continuous monitoring earns its keep
Continuous monitoring belongs on assets where the plant can't tolerate delayed visibility. A cooling tower fan that's hard to access, a critical process compressor, or a remote induced draft fan are common examples.
These assets usually share several traits:
- High consequence of failure: The machine can stop production, create safety exposure, or force major reactive work.
- Difficult access: The team can't gather route data easily or safely.
- Fast fault progression: Defects can move from early warning to functional failure faster than the route interval.
- Limited staffing: The plant doesn't have enough specialist time to maintain route depth on every critical asset.
The decision isn't “wireless or portable.” It's “what surveillance level matches this risk?” Plants that need structure in that process usually benefit from a vibration monitoring route setup guide before they expand hardware.
A simple decision screen helps:
| Decision Factor | Route-Based Monitoring | Continuous Monitoring |
|---|---|---|
| Asset criticality | Lower to moderate | High |
| Access | Easy and safe | Difficult, remote, or hazardous |
| Failure speed | Usually slower or detectable between rounds | Can progress between route intervals |
| Staffing | Requires technician time for collection | Reduces manual collection demand |
| Data burden | Lower volume, easier review | Higher review load if alarms aren't managed well |
Plants don't fail because they lacked sensors on every asset. They fail because they put the wrong monitoring method on the wrong machine.
Best Practices for Ensuring High-Quality Data
Poor data collection can make a healthy machine look sick and a damaged machine look normal. That's why data quality isn't a nice-to-have. It's the whole foundation.
Bad data creates bad work orders
If a technician places a magnet on a dirty, curved, or flexible surface, the reading may shift enough to send the analyst toward the wrong fault. If the point location changes from route to route, the trend line stops meaning what the plant thinks it means. If the collector setup doesn't support the frequencies tied to the expected fault, the defect may be there and still go unseen.
This gets even more important when the plant is trying to catch early faults hiding inside normal machine vibration. A vibration analysis application overview notes that modern analyzers can offer up to 160 dB dynamic range, and that wider range matters because it helps capture both low-level fault signals and high-amplitude events without distorting the measurement.
That “without distorting the measurement” point matters in real life. On a motor driving a crusher feed conveyor, the machine may have strong normal vibration from the process. The analyst still needs enough clean signal quality to identify the smaller defect signatures riding underneath it.
What good collection discipline looks like
A plant gets better results when it standardizes the basics:
- Mounting method: Use a repeatable sensor attachment method and keep measurement points consistent.
- Surface condition: Clean the spot, avoid unstable mounting surfaces, and don't collect from guards or thin sheet metal unless the point was intentionally designed there.
- Machine state: Record readings under comparable operating conditions when possible.
- Instrument setup: Configure the collection to capture the fault family being investigated, not just a generic reading.
- Calibration and verification: Keep instruments checked and confirm suspicious readings before creating work.
For motor-driven assets, consistency matters just as much as sophistication. A technician who takes the same clean point every time often provides better decision support than someone using advanced tools with sloppy route habits. Teams that need a machine-specific starting point often use references like vibration analysis of motor systems to align collection points and failure expectations with the actual asset design.
Field check: Before accepting a surprising reading, confirm the point, mounting, load, and speed. A second clean reading often saves an unnecessary work order.
An Analyst's Workflow for Interpreting Vibration Data
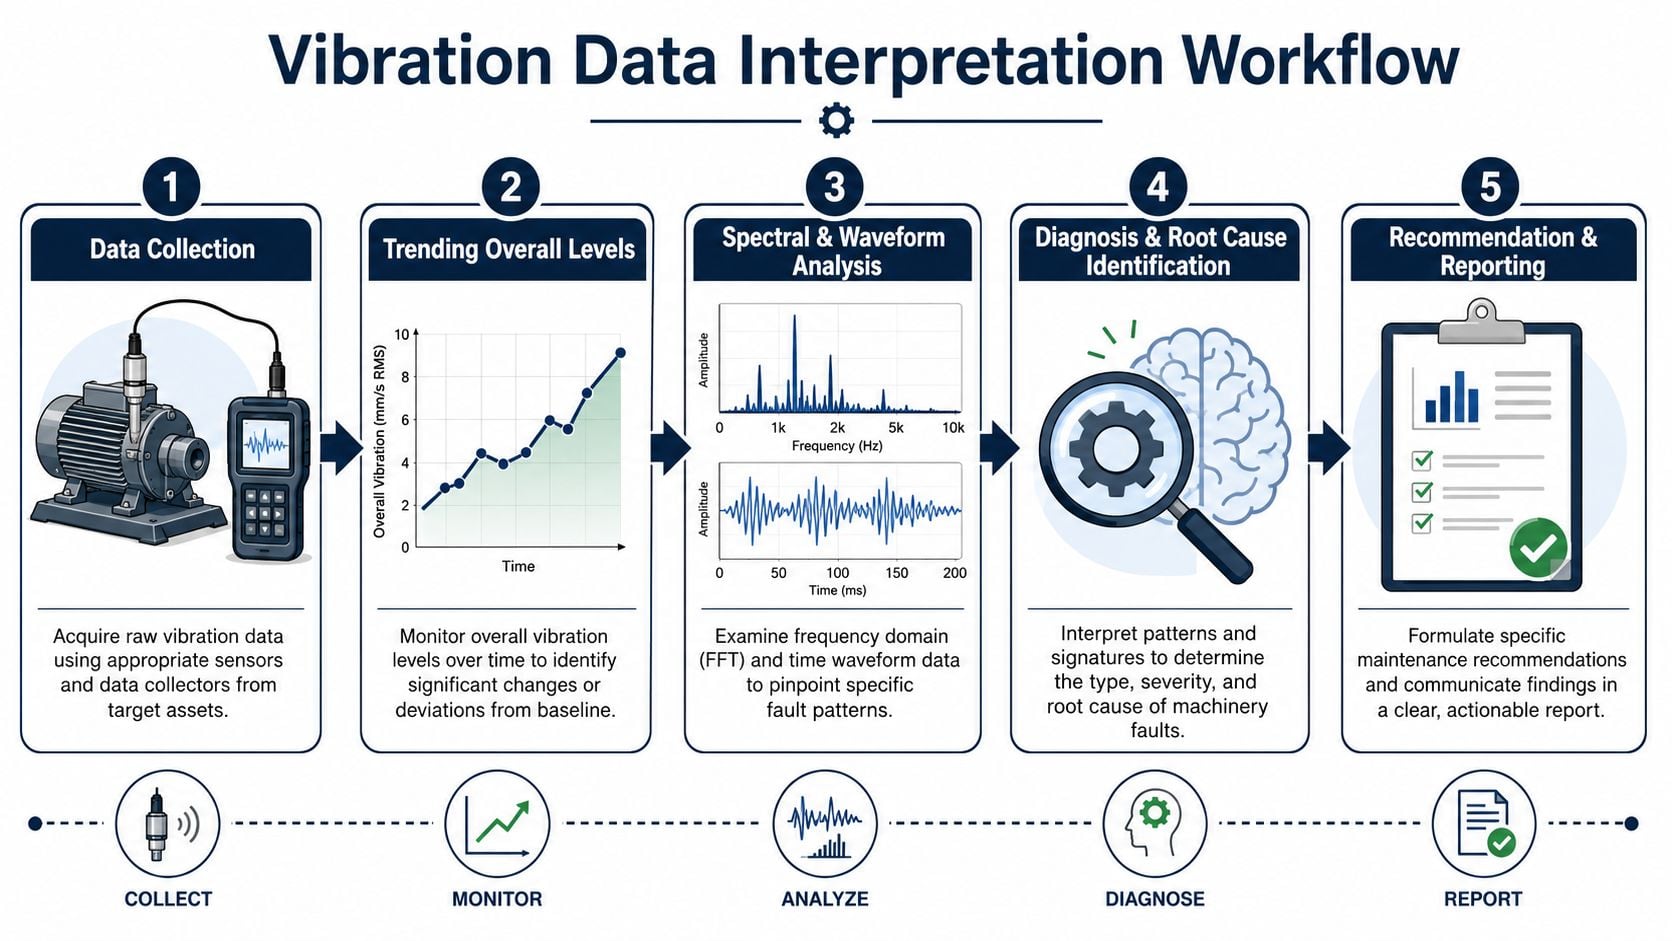
Good analysts don't jump straight from one spectrum to one conclusion. They move through a workflow. That workflow keeps the diagnosis tied to evidence instead of habit.
Start with trend, then diagnose
The first question isn't “what fault is this?” It's “what changed?” Trend data answers that. If overall vibration has been stable and then starts moving, the analyst knows where to focus. If the machine has always run rough but hasn't changed, the problem may be chronic but not emergent.
After the trend review, the analyst usually checks the FFT spectrum, where the fault pattern begins to separate. Running-speed activity may point toward imbalance or alignment issues. Harmonics may suggest looseness or mechanical complexity. High-frequency activity may indicate developing bearing trouble.
Then comes the time waveform. This view matters because some problems aren't clean in the spectrum alone. Impacts, rubs, and intermittent mechanical contact often reveal themselves more clearly in the time signal than in the spectral peaks.
A practical workflow on a gearbox-driven mixer might look like this:
- Review baseline and trend: Confirm whether the increase is new, gradual, or sudden.
- Check spectrum shape: Look for running-speed activity, harmonics, and fault-related high-frequency energy.
- Review time waveform: Determine whether the signal is smooth, impacting, modulated, or unstable.
- Compare directions and locations: Radial and axial behavior can help separate rotor, structural, and coupling problems.
- Tie diagnosis to maintenance action: Recommend inspection, planned repair, alignment check, lubrication review, or immediate escalation depending on severity.
How variable-speed equipment changes the workflow
Variable-speed assets break simple alarm logic. A fan on a VFD doesn't produce one fixed signature. Its normal pattern shifts with RPM and load, which means a fixed threshold can create nuisance alarms or hide a real defect.
A practical discussion of vibration analysis under changing operating conditions highlights this challenge on VFD-driven assets and points to operating-state segmentation and order tracking as the key methods for normalizing vibration data for RPM and load. That reduces false alarms while preserving early fault detection.
Many plants struggle in this area. They collect more data from connected sensors, but they don't organize it by operating state. The result is a mix of normal signatures from different process conditions. The analyst then ends up comparing unlike data and calling it trend growth.
Order tracking helps because it relates vibration to shaft orders instead of fixed frequency values. On variable-speed pumps, fans, and reciprocating equipment, that's often the difference between a trustworthy diagnosis and a wasted shutdown.
On variable-speed machines, the question isn't whether the vibration changed. The question is whether it changed after speed and load were accounted for.
Your Implementation and ROI Checklist
A good vibration program starts smaller than most plants expect and more disciplined than most plants plan. The team doesn't need every asset instrumented on day one. It needs the right assets, the right method, and a review process that leads to action.
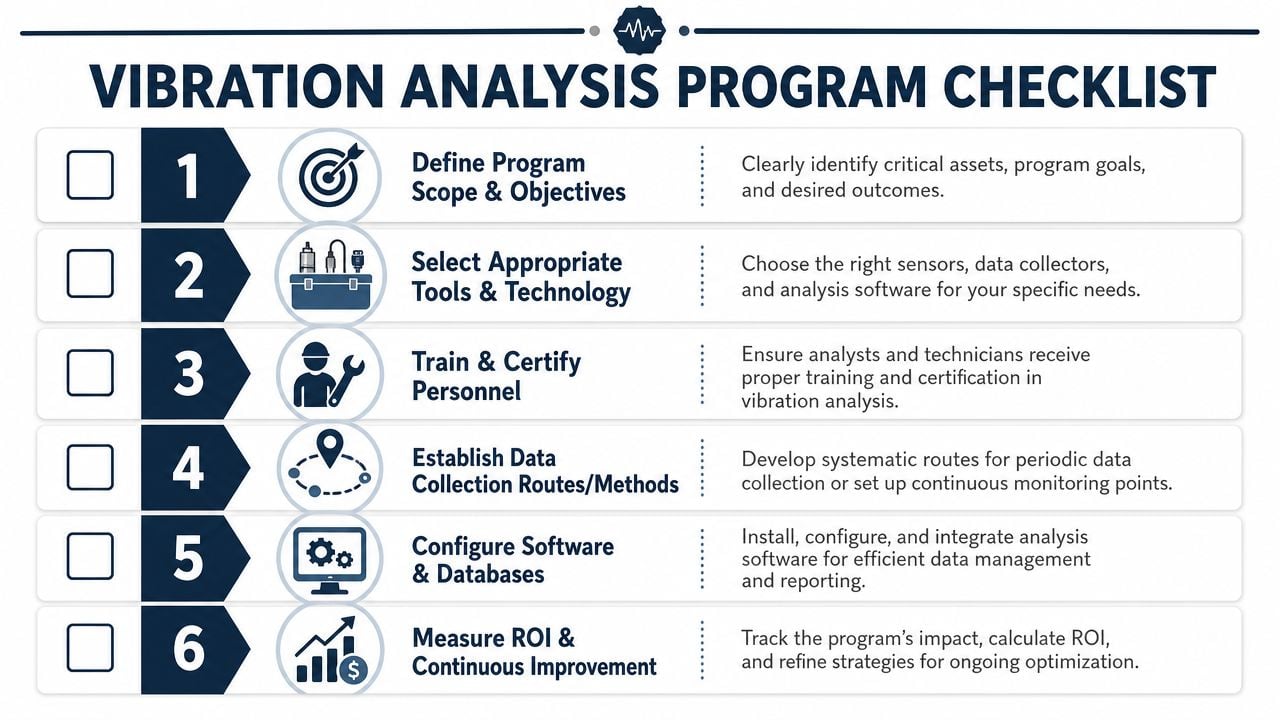
A practical rollout checklist looks like this:
- Define scope first: Rank assets by consequence of failure, maintainability, access difficulty, and expected fault behavior.
- Match tools to risk: Use route-based collection where periodic snapshots are enough. Reserve continuous monitoring for assets that justify it.
- Pilot before scaling: Start with a focused set of pumps, motors, fans, compressors, or gearboxes that matter to production.
- Standardize data collection: Lock down points, mounting methods, naming, and review cadence before adding more sensors.
- Build the response path: Decide who reviews exceptions, who confirms defects, and how findings become planned work.
- Measure value in avoided disruption: Compare program cost against avoided emergency labor, reduced secondary damage, fewer rushed shutdowns, and better scheduling of repairs.
A simple example is a wastewater lift station with several pumps. If the pilot catches one developing bearing issue early enough to repair it during a planned outage instead of during a forced process interruption, the plant has already learned what matters most. The value isn't just in detection. It's in having enough warning to choose the repair window.
The plants that get real return from vibration analysis tools are the ones that treat them as part of a maintenance decision system, not as a standalone technology purchase.
If the plant needs help deciding which assets belong on routes, which ones need continuous monitoring, or how to get cleaner diagnostics from variable-speed equipment, Forge Reliability offers a free reliability assessment to identify practical next steps based on actual asset risk and failure behavior.