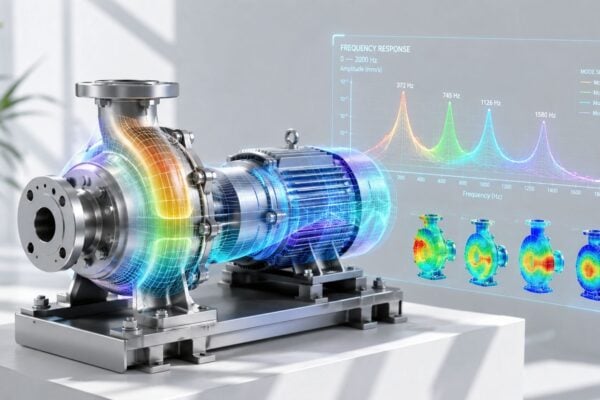
A Sunday-night shift at a chemical plant turns urgent when a 750-kW motor driving a centrifugal pump seizes. The motor's inboard bearing has been spalling for weeks, but the defect stayed below the threshold of ordinary operator checks. Debris fouls the stator windings, the overload trips, and the reactor feed line stops.
The production interruption lasts 36 hours. An emergency replacement bearing costs $48,000, a crane must be called in under pressure, and a customer shipment penalty follows. Those figures belong to the scenario, not a reported case study. The reliability lesson is still familiar: the repair bill is only one part of a rotating-equipment failure. Lost production, emergency labor, rushed logistics, and secondary damage often matter more.
Four weeks earlier, the same motor could have told a different story. Rising high-frequency vibration on the dewatering pump, a broadband floor on the pillow-block accelerometer, and a faint 12.2 kHz bearing tone would have given an analyst a reason to inspect the inboard bearing before seizure.
Predictive maintenance is the disciplined practice of collecting and interpreting those condition signals before a functional failure. It changes the maintenance question from “When is the next service due?” to “What measurable degradation is developing, and what work order should it trigger?”
Table of Contents
- The Unplanned Failure That Predictive Maintenance Was Built to Prevent
- Predictive Maintenance vs Preventive and Reactive Strategies
- The Core Sensor Technologies and the Failure Modes They Catch
- Route-Based and Continuous Monitoring Workflows
- From Sensor Reading to Confirmed Diagnosis to Work Order
- KPIs, Cost of Downtime, and Where ROI Actually Shows Up
- Implementation Roadmap and the Pitfalls That Stall Programs
- Common Questions From Plant Leaders and Your Next Step
The Unplanned Failure That Predictive Maintenance Was Built to Prevent
The Sunday-night failure follows a recognizable progression. Spalling, a fatigue defect in which small pieces of a bearing raceway or rolling element break away, begins inside the motor's inboard bearing. As the damaged surface passes through the load zone, each impact creates vibration energy.
The bearing doesn't need to fail immediately for the motor to become unsafe. Loose debris can circulate through the bearing, lubrication can deteriorate, temperature can rise, and the rotor can lose stable support. If the defect continues, the damaged bearing can overload the motor, damage adjacent components, and contribute to the winding contamination described in the plant scenario.
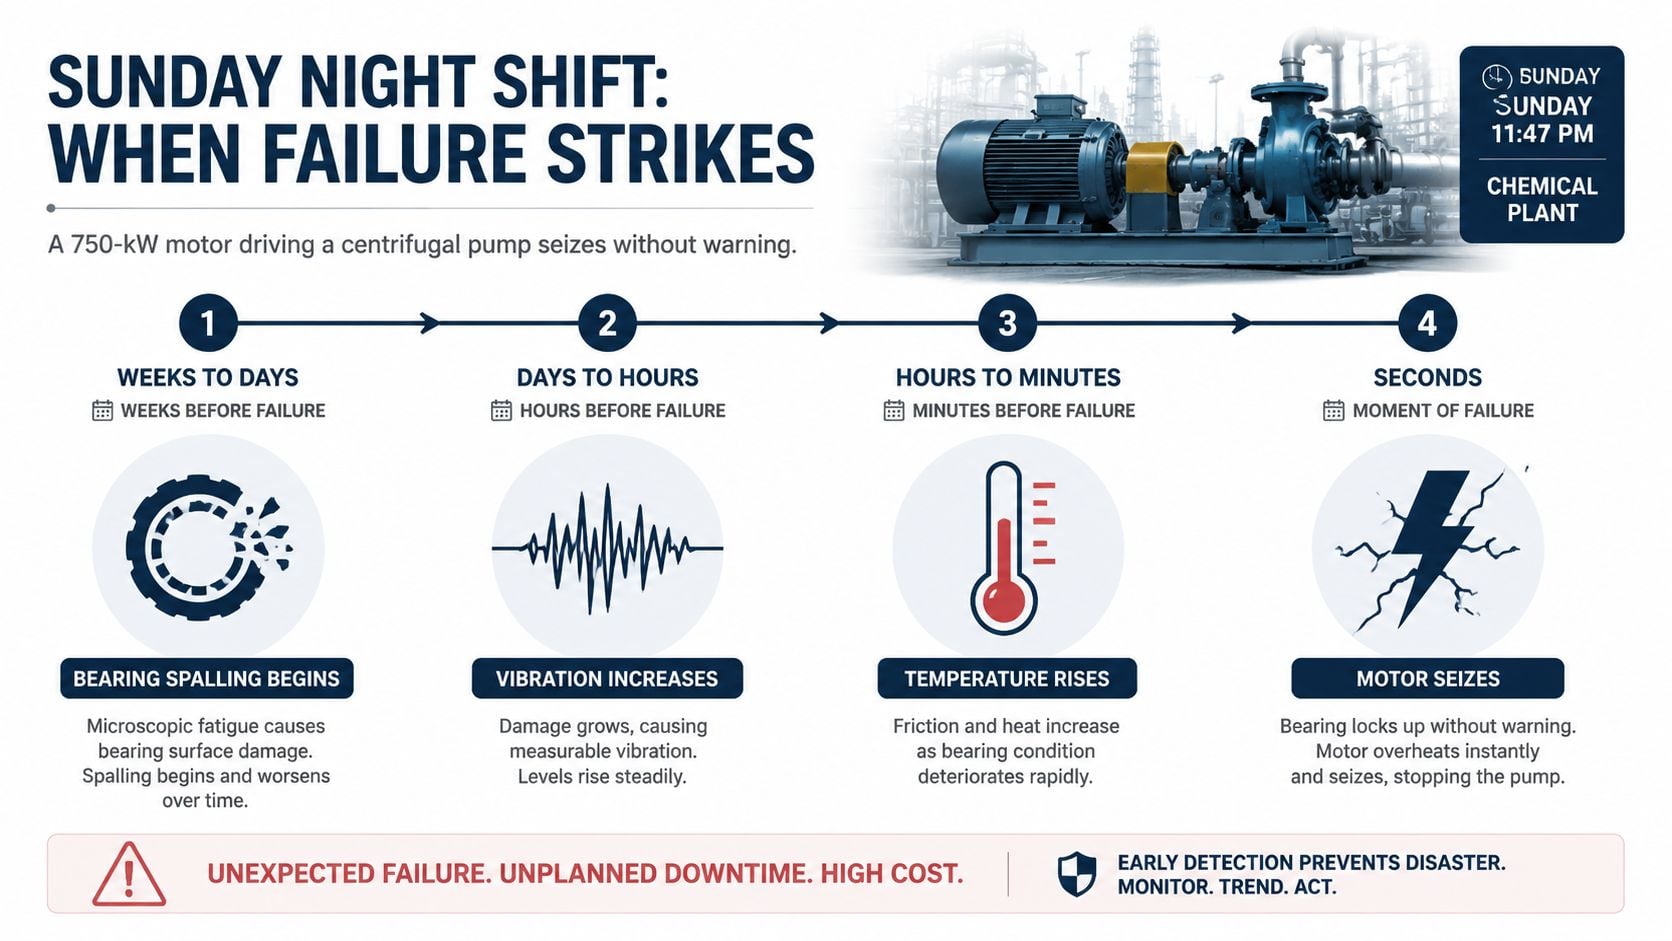
The signals existed before the breakdown
The important point isn't that one sensor magically predicts every failure. The point is that degradation leaves physical evidence, and the evidence becomes useful when technicians collect it consistently and compare it with a known baseline.
For a pump motor, the warning pattern might include:
- High-frequency vibration: Impacts from a developing bearing defect become more prominent than the normal running signature.
- Broadband vibration floor: The overall energy across a wide frequency range rises, suggesting roughness, looseness, lubrication distress, or another developing mechanical problem.
- Bearing-tone energy: A narrow spectral feature can help an analyst distinguish a bearing-related fault from imbalance or misalignment.
Research on vibration-based predictive maintenance describes how sensor data, analytics, and connected monitoring can improve failure prediction for equipment with measurable dynamic signatures. As a defect grows, vibration energy and frequency content can shift, allowing a team to trend severity and investigate before damage spreads to shafts, couplings, seals, or nearby components. Research on vibration-based predictive maintenance and IoT integration
Practical rule: A predictive program doesn't prevent physics from changing. It gives the maintenance team enough warning to respond while the repair is still controlled.
Industrial IoT helped make this approach mainstream because sensor networks, analytics, and connected asset monitoring can detect failure signatures before a breakdown occurs. Industry reporting commonly places potential reductions from predictive maintenance at 30% to 50% for unplanned downtime and 18% to 25% for maintenance costs compared with traditional approaches. Industry data on predictive maintenance outcomes
The work is only valuable when the signal becomes a decision. A rising vibration trend should lead to a bearing inspection, lubrication review, or planned replacement, not merely another dashboard alert. The following comparisons and workflows show how teams decide which strategy and sensor answer fit a particular pump, motor, gearbox, or compressor.
Predictive Maintenance vs Preventive and Reactive Strategies
The same centrifugal pump can be managed through three different maintenance philosophies. Reactive maintenance allows the pump or motor to run until it fails. Time-based preventive maintenance replaces or services components on a calendar interval. Predictive maintenance uses measured condition to decide when intervention is justified.
Reactive maintenance has a legitimate place. A small, non-critical cooling-water pump with a readily available spare may not justify extensive monitoring. The plant accepts the failure risk because the consequence is limited and replacement is simple. The same choice becomes dangerous for a reactor feed pump, a bottleneck compressor, or a motor with no installed standby.
Time-based preventive maintenance reduces some surprise failures, especially when a failure mode is strongly related to operating time. However, a bearing replaced every 12 months may still be healthy at the service date, while another bearing may develop a defect between scheduled inspections. Calendar work also consumes outage time and can introduce installation errors.
Predictive maintenance measures the asset's actual condition. A vibration trend on the pump motor can show whether imbalance, misalignment, looseness, or bearing damage is progressing. The team then schedules the repair when the evidence and production window support it.
Comparison matrix
| Dimension | Reactive | Time-Based Preventive | Predictive |
|---|---|---|---|
| Trigger | Functional failure | Calendar or operating interval | Condition trend or alarm threshold |
| Planning horizon | Immediate response | Planned interval | Based on defect progression and operating risk |
| Spare-parts inventory | Emergency stock or expedited purchase | Planned replacement stock | Parts ordered after diagnosis and risk review |
| Labor intensity | High emergency labor | Recurring scheduled labor | Analyst, inspection, and targeted craft labor |
| Failure risk | Highest | Reduced, but interval-dependent | Reduced when failure signatures are detectable |
| Cost per avoided downtime hour | Usually highest after failure | Variable, with possible over-maintenance | Most attractive on high-consequence assets |
A mature plant rarely chooses one philosophy for every asset. Reactive maintenance can cover low-criticality equipment. Preventive maintenance remains useful for lubrication, statutory inspections, and time-predictable wear. Predictive maintenance adds condition evidence where load, environment, duty cycle, or failure consequence makes calendar work too blunt.
A practical decision framework is available in Forge Reliability's comparison of predictive and preventive maintenance. The central question is not whether predictive maintenance sounds advanced. It's whether the asset's failure mode can be detected early enough, and whether the plant can act on the warning.
The Core Sensor Technologies and the Failure Modes They Catch
A sensor has value only when it answers a reliability question. For a pump, motor, gearbox, or compressor, the question might be “Is the bearing deteriorating?”, “Is the lubricant carrying wear debris?”, or “Is the motor developing an electrical fault?” Each technology sees a different part of the failure process.
Vibration analysis
Vibration analysis measures mechanical motion, commonly through accelerometers mounted on bearing housings. On a centrifugal pump or motor, it can identify bearing race defects, imbalance, misalignment, looseness, resonance, and coupling problems.
The analyst compares the current spectrum and waveform with a baseline. Frequency spectrum means the vibration signal separated into frequency components. A dominant component at running speed may support an imbalance or misalignment investigation, while defect-related impacts may appear in higher-frequency or enveloped data.
The work-order decision depends on the fault. A bearing-impact trend may trigger a bearing inspection and planned replacement. A strong running-speed component may trigger alignment verification, soft-foot checks, or balance correction. The sensor doesn't prescribe the craft activity by itself. The diagnostic interpretation does.
Forge Reliability describes the role of condition monitoring systems in connecting equipment condition with maintenance decisions.
Oil analysis and wear-debris ferrography
Oil analysis examines lubricant condition and the material suspended in it. In a gearbox, it can reveal lubricant breakdown, additive depletion, water or particulate contamination, and evidence of component wear. Ferrography is a wear-debris technique that separates and examines magnetic particles to help identify the severity and mechanism of wear.
For example, a gearbox sample containing increasing ferrous debris can support an inspection of gear teeth, bearings, or lubrication practices. The work order might call for correcting contamination ingress, filtering or changing the lubricant, checking breathers and seals, or planning an internal inspection.
Oil results need operating context. A particle count without sample identification, lubricant grade, running hours, or recent maintenance history can produce a misleading conclusion.
Infrared thermography
Infrared thermography uses a thermal camera to identify abnormal surface temperature patterns. On a motor, a hot electrical termination can indicate a loose connection or excessive resistance. On a fired heater, an unusual thermal pattern may point to refractory lining loss. A fouled heat exchanger can also create a temperature distribution that differs from normal operation.
A work order should name the suspected mechanism. “Inspect hot motor” is weak. “De-energize and inspect motor terminal connections for looseness or overheating, then verify torque and insulation condition” gives the electrician a defined action.
Airborne and structure-borne ultrasound
Ultrasound detects high-frequency sound produced by turbulence, friction, impacts, or leaks. Airborne ultrasound can locate compressed-air leaks or abnormal steam-trap behavior. Structure-borne ultrasound can identify a lubrication-starved pillow-block bearing before the overall vibration level becomes obvious.
An ultrasound alarm on a pillow-block bearing may route a lubrication request, but lubrication shouldn't be applied blindly. The technician should confirm the grease type, quantity, relubrication method, bearing temperature, and operating condition.
Motor current signature analysis
Motor current signature analysis, or MCSA, examines electrical current patterns to identify motor and driven-equipment problems without touching the running motor. It can support detection of broken rotor bars, air-gap eccentricity, and coupling misalignment.
A step change in sideband energy around the motor's electrical signature may route a motor-deck inspection, coupling review, or electrical test. MCSA is especially useful where access to the motor housing is restricted, but it should be interpreted with process load and drive information.
Computer vision can complement these condition methods for visual inspections, guarding checks, and process observations. A practical overview of computer vision in manufacturing helps place visual data alongside vibration, thermal, acoustic, and electrical evidence.
Pairing technologies increases diagnostic confidence. Vibration may show a gearbox problem, while oil analysis can reveal whether the damage is generating ferrous debris. Together, the results can distinguish a developing gear fault from a lubrication issue and produce a more precise work order.
Route-Based and Continuous Monitoring Workflows
A plant doesn't need permanent sensors on every motor. Route-based monitoring uses a technician's handheld instrument to collect readings at defined points and intervals. Continuous monitoring uses permanently installed sensors that stream or transmit measurements while the asset operates.
A weekly vibration route may suit non-critical pumps with gradual failure progression. A critical compressor may need daily ultrasound checks, continuous vibration, or both if a missed defect can stop production. The decision rests on consequence, detectability, degradation speed, accessibility, and the plant's ability to respond.
| Attribute | Route-Based | Continuous |
|---|---|---|
| Data cadence | Scheduled rounds | Ongoing or frequent automatic collection |
| Best fit | Broad equipment coverage | Critical or fast-changing assets |
| Technician involvement | Required for collection | Focuses on review and response |
| Failure visibility | Can miss rapid degradation between routes | Better visibility during changing conditions |
| Installation burden | Lower | Higher |
| Typical workflow | Collect, upload, analyze, create work order | Alert, validate, diagnose, create work order |
A permanent vibration system costing $15,000 on a $2 million bottleneck compressor is a scenario for evaluating payback, not a universal price rule. Continuous monitoring may make sense when one missed event carries a much larger consequence than the installed system. Route coverage may remain more economical for many small motors whose failures are slower, less consequential, or easily isolated.
Simulation and IoT design can help teams test connectivity and operating assumptions before expanding a monitoring architecture. Faberwork's discussion of IoT simulation for mitigating system-growth risk provides useful context for that planning problem.
A hybrid program is often practical. Route-based monitoring establishes broad coverage, while continuous systems concentrate on critical compressors, high-speed motors, large gearboxes, and other bottleneck assets. The available vibration analysis tools should support the chosen cadence, mounting method, data quality, and analyst workflow.
From Sensor Reading to Confirmed Diagnosis to Work Order
A raw reading isn't a diagnosis. Consider a 750-kW induced-draft fan motor with a progressing outer-race bearing defect. The reliability team needs to move from measurement to action without treating every alarm as proof of failure.
Step one establishes the physical change
An accelerometer may record acceleration in g RMS, a root-mean-square measure of vibration acceleration. The analyst may also examine velocity in millimeters per second and the running-speed component, commonly called 1x shaft frequency because it occurs once per shaft revolution.
The first question is whether the reading has changed from the motor's established baseline under comparable load and speed. A single high value can result from mounting error, process change, resonance, or a transient condition.
Step two isolates the defect signature
Envelope demodulation filters and processes high-frequency impact information so periodic bearing impacts become easier to identify. For an outer-race defect, the analyst looks for a repeating BPFO, or ball-pass frequency outer race, impact train.
The analyst then checks severity against the applicable machine-vibration guidance and bearing-damage classification framework, including ISO 10816 and ISO 15243 where appropriate. Those references support consistent interpretation, but they don't replace engineering judgment. Machine design, bearing type, speed, load, mounting, and historical trend still matter.
Step three confirms before scheduling
Confirmation can come from a second measurement method. Ultrasound may detect impact-related noise, while oil analysis may show a rising particle load or ferrous wear debris. A visual inspection can check lubrication condition, contamination, looseness, or evidence of overheating.
Diagnosis must explain the mechanism, not merely repeat the alarm.
The final work order should state the action: procure the correct bearing, verify shaft and housing fits, inspect lubrication and seals, schedule the fan outage, assign the appropriate craft, and capture post-repair readings. A condition-based workflow becomes useful when the alert contains enough evidence to plan the job.
The work-order management process should preserve the defect code, asset location, measurement evidence, recommended action, priority, and completion findings. That history improves later failure analysis and helps the team distinguish recurring installation problems from genuine component fatigue.
KPIs, Cost of Downtime, and Where ROI Actually Shows Up
Predictive maintenance earns support when it connects condition data to business loss. A plant leader doesn't need a dashboard full of alarms. The leader needs to know whether the program reduces unplanned downtime, improves repair planning, and protects production capacity.
Unplanned downtime hours show lost availability. Mean time between failures, or MTBF, indicates the average operating interval between functional failures. Mean time to repair, or MTTR, measures how long the asset remains unavailable while the team restores it.
Two workflow metrics complete the picture:
- Alarm-to-work-order conversion rate: The share of actionable alarms that become properly scoped work orders.
- False-positive ratio: The share of alerts that investigation or follow-up disproves.
Each KPI connects to a financial line. Downtime hours affect production and margin. MTBF reflects recurring failure exposure. MTTR reflects labor, spares, access, and outage coordination. Conversion rate shows whether the program is producing action, while false positives reveal wasted analyst and craft capacity.
A scenario can clarify the payback logic. Suppose a critical compressor produces $40,000 per hour of lost margin, a predictive program costs $120,000 per year, and one avoided breakdown would have stopped the compressor for two days. The avoided loss would be $1.92 million, calculated from 48 hours multiplied by $40,000 per hour. That scenario more than covers the annual program cost, but it doesn't prove that every compressor or every pump will produce the same return.
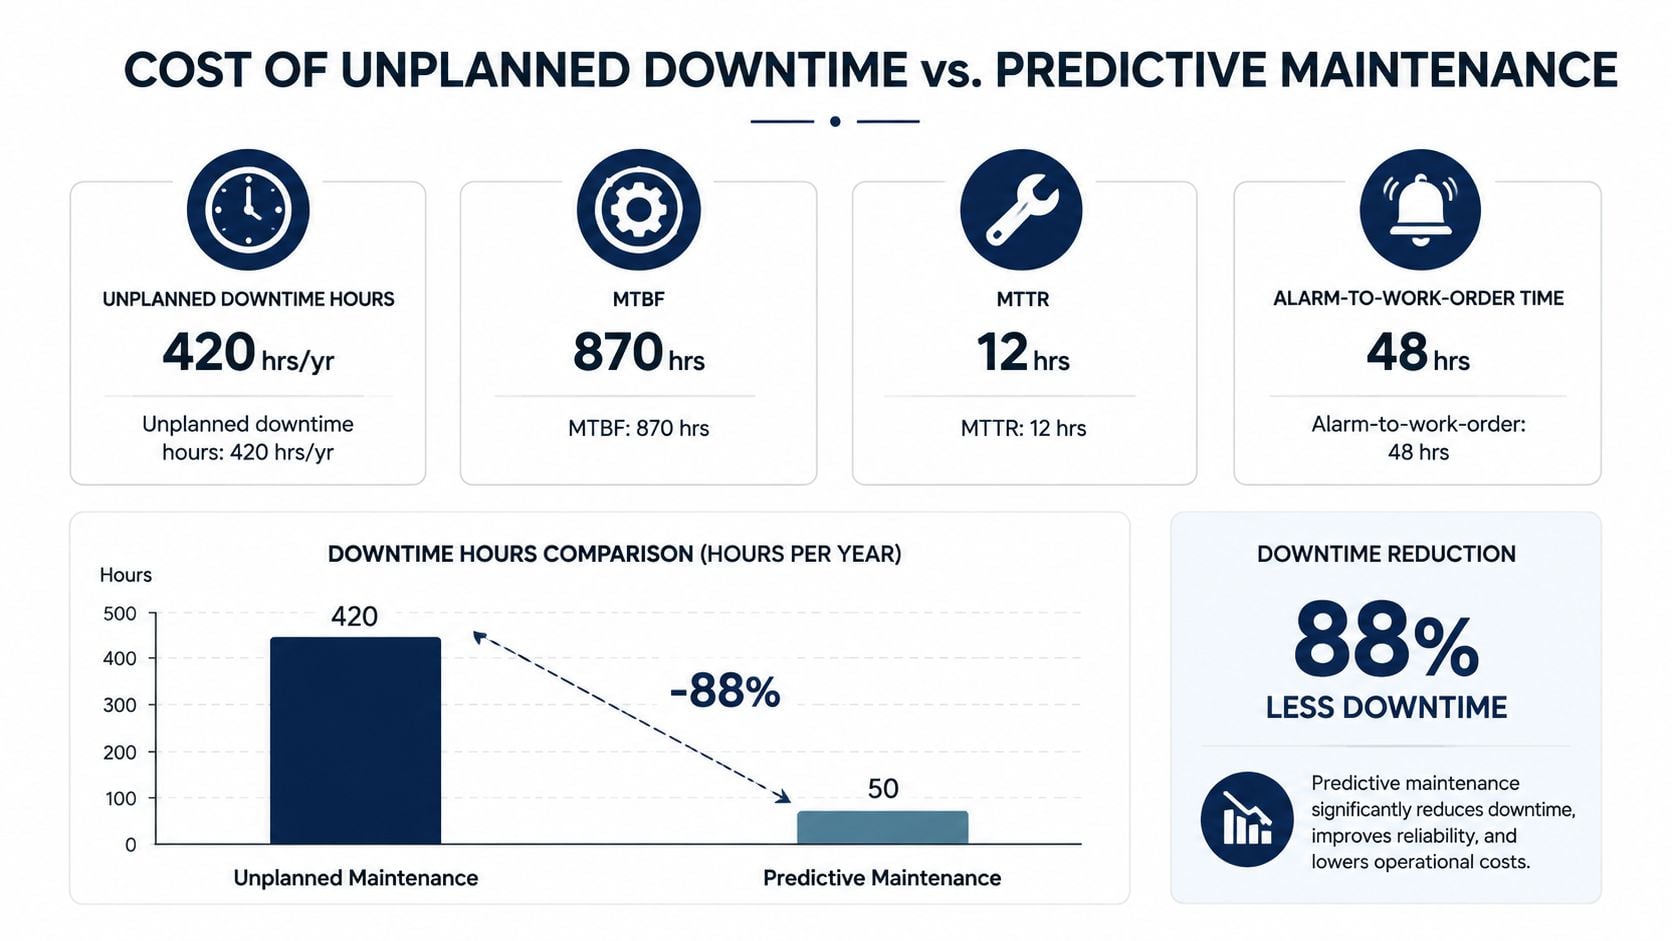
Independent industry reporting places predictive maintenance's commonly cited potential at 30% to 50% less unplanned downtime and 18% to 25% lower maintenance cost versus traditional approaches. Reported predictive maintenance reduction ranges Those ranges should be treated as context, not a guaranteed plant result.
ROI often disappoints on low-criticality assets, redundant equipment, and machines whose failure modes produce no detectable lead signal. It also weakens when a plant buys sensors without a failure-mode plan, lacks analyst capacity, or can't convert findings into scheduled work.
Implementation Roadmap and the Pitfalls That Stall Programs
A pump bearing begins to deteriorate, but the plant has no agreed response. A vibration trend may show the change, yet the finding creates value only when someone confirms the diagnosis and schedules the right repair. A workable predictive maintenance program therefore grows in stages, starting with rotating equipment whose failure consequence and detectable failure mode are clear.
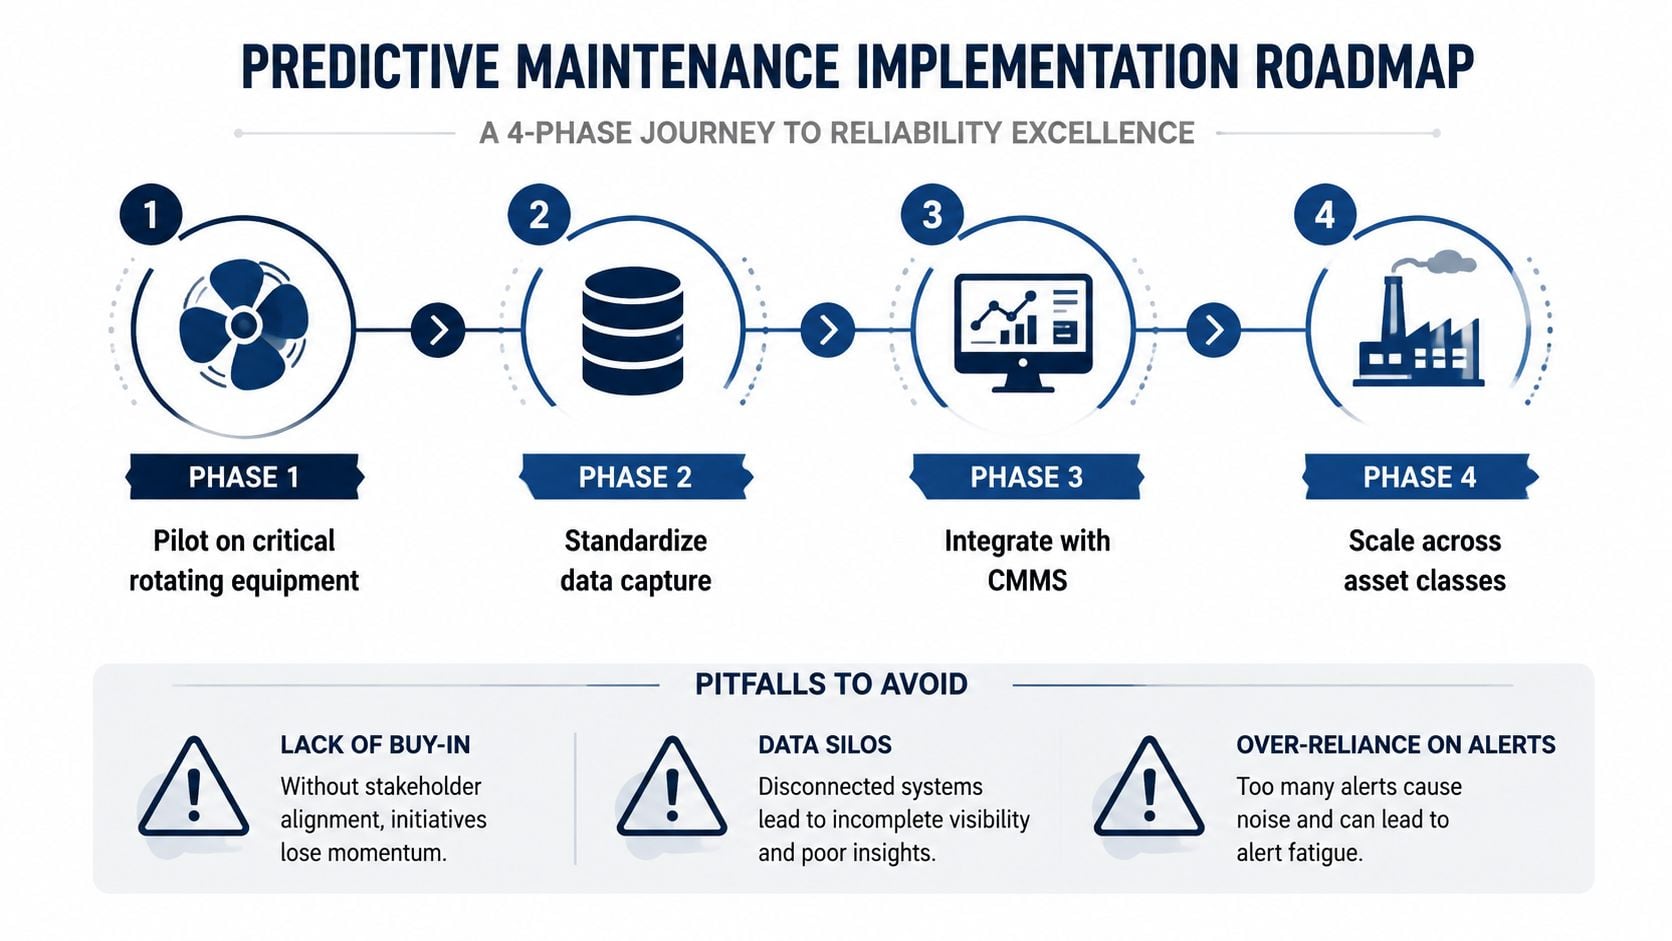
Four phases with readiness checks
- Pilot critical rotating equipment: Select a pump, gearbox, compressor, or large motor that can affect production. Record baseline vibration spectra, operating state, asset tags, failure modes, and consequence ranking. The pilot is not ready if the team cannot state which failure requires action.
- Standardize data capture: Define sensor location, mounting method, speed and load context, sample settings, lubrication records, and alarm ownership. For example, an accelerometer mounted on a gearbox housing must use a repeatable location and firm contact, or its readings may not support a reliable trend.
- Integrate with the CMMS: A computerized maintenance management system should connect condition findings to failure codes, priorities, parts, craft requirements, and planned outage dates. The work order must state the response, such as inspecting a pump coupling or replacing a confirmed motor bearing.
- Scale across asset classes: Extend the method to pumps, motors, gearboxes, and compressors after the pilot produces repeatable diagnoses and completed work orders. Each sensor should answer a reliability question and trigger a defined decision, rather than add another dashboard.
The pitfalls that expose weak readiness
A sample rate that misses gear-mesh frequencies can hide gearbox damage. Route intervals that are too long can miss a rapidly degrading bearing. An accelerometer mounted on paint, rust, a flexible bracket, or an inconsistent location can create a misleading trend.
Alert fatigue appears when the program produces more findings than analysts can validate. Skills gaps, legacy-system integration, limited data access, unclear maintenance ownership, and insufficient employee training can all stall implementation. Implementation challenges involving readiness, integration, data, and skills
A checkpoint matrix gives planners a practical budget decision:
| Checkpoint | Ready condition | Warning condition |
|---|---|---|
| Asset scope | Criticality and failure modes documented | Equipment selected by convenience |
| Data quality | Repeatable locations and operating context | Inconsistent mounting or missing context |
| Diagnosis | Alerts reviewed by qualified personnel | Alerts accepted without confirmation |
| Workflow | CMMS work orders contain specific actions | Findings remain in dashboards or email |
| Capability | Analysts and craftspeople have defined roles | No owner for validation or response |
At month three, a useful program may have clean baselines and a small number of validated findings. At month twelve, it should also show closed-loop work orders, post-repair verification, and updated failure knowledge. The 12-month reliability program roadmap can help planners organize that progression.
Common Questions From Plant Leaders and Your Next Step
Which assets deserve continuous monitoring first?
Critical compressors and high-speed motors above 1000 kW often deserve early evaluation when their failure can stop a process, damage connected equipment, or create a difficult restart. The decision still depends on redundancy, failure detectability, operating regime, and the plant's ability to respond to an alert.
A smaller motor can also justify continuous monitoring if it drives a bottleneck pump or operates in a hazardous, inaccessible, or highly variable environment. Asset criticality should determine monitoring intensity, not motor size alone.
Is vibration alone enough?
Usually, no. Vibration is powerful for rotating mechanical faults, but oil analysis can reveal lubricant and wear conditions, thermography can expose electrical and thermal anomalies, ultrasound can identify lubrication or leak problems, and MCSA can investigate electrical signatures without direct motor contact.
A gearbox with ambiguous vibration should receive an oil sample. A motor with unusual current sidebands should receive an electrical and mechanical inspection. The sensor mix should follow the failure modes.
How can a plant staff the program without in-house analysts?
A plant can begin with structured route collection, clear escalation rules, and a remote diagnostics laboratory or specialist partner during the ramp-up period. Internal technicians still need training in mounting, data capture, lubrication practice, and work-order execution, even when advanced interpretation is provided externally.
Forge Reliability provides predictive maintenance and condition-monitoring services using vibration, oil, temperature, and current data across route-based and continuous formats. Its reliability programs can also incorporate asset criticality, maintenance workflow, and CMMS governance for plants that need outside analytical support.
Who owns the program when departments disagree?
One reliability owner should control the program's priorities, budget, alarm governance, and escalation rules. Operations supplies process context and outage windows. Maintenance planners convert findings into executable work. Reliability engineers validate diagnosis and monitor program performance.
That ownership model applies across refining, power generation, chemical processing, and discrete manufacturing. A sensor alert becomes valuable only when the responsible people agree on its meaning and the next physical action.
Plant leaders can start with a free predictive-maintenance readiness assessment that benchmarks current condition-monitoring maturity, asset coverage, data quality, and work-order execution against practical industry norms.
Forge Reliability helps manufacturers and industrial facilities design predictive maintenance programs around pumps, motors, gearboxes, compressors, and other critical assets, using condition monitoring and reliability workflow expertise. Visit Forge Reliability to request a free reliability assessment and identify the monitoring strategy most likely to reduce unplanned downtime.