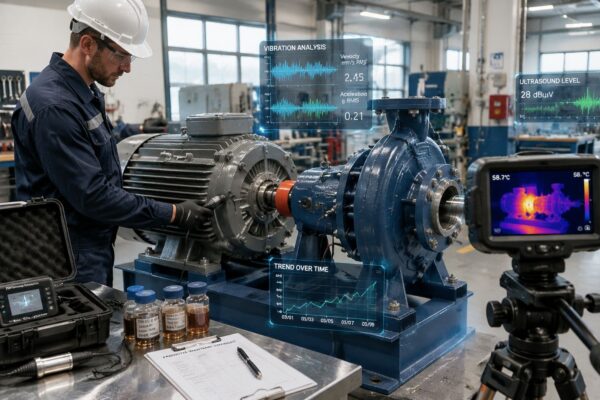
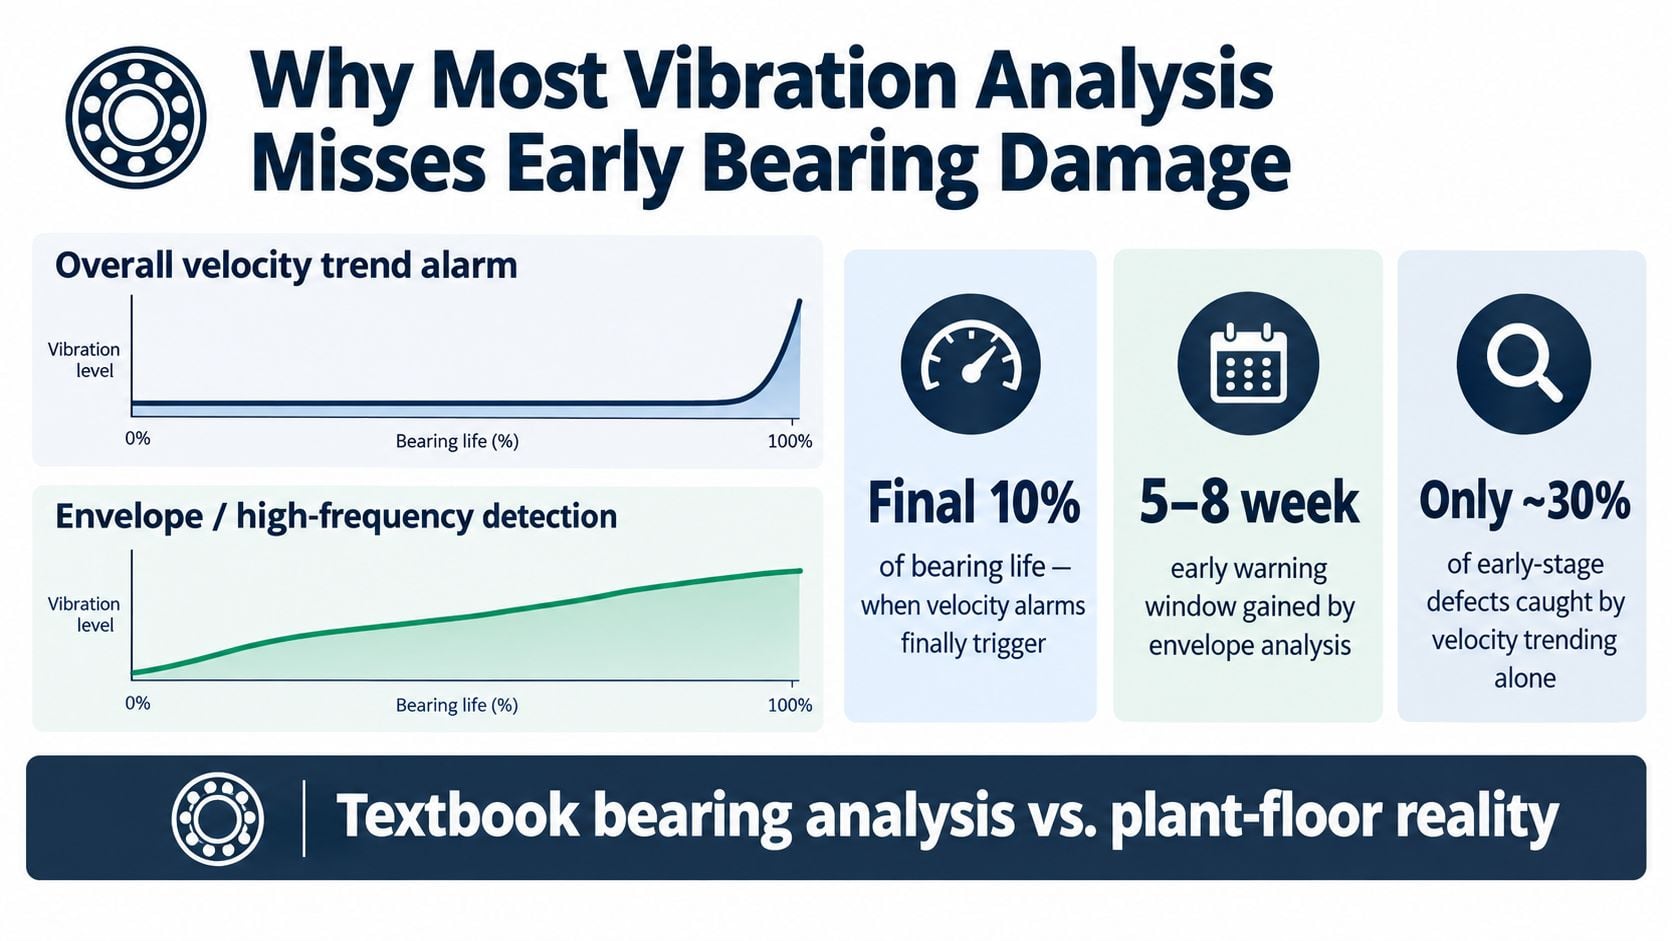
A bearing can be dangerously close to failure while overall vibration still looks acceptable. True subsurface fatigue accounts for less than 3% of in-service failures in modern rolling-element bearings, while contamination, lubrication problems, misalignment, poor fits, overload, and false brinelling create much of the practical failure burden. SKF's bearing failure guidance also notes that conventional acceleration and velocity measurements may become useful only when less than 10% of residual bearing life remains.
That changes the question reliability teams should ask. The objective is to identify a failed bearing. It's to recognize the mechanical condition that is damaging the bearing, decide how urgently the team must intervene, and prevent damage from spreading to shafts, seals, couplings, housings, and driven equipment.
Table of Contents
- Why Most Vibration Analysis Misses Early Bearing Damage
- Setting Up Your Bearing Vibration Measurement Workflow
- Interpreting Spectral Signatures of Bearing Defects
- Envelope Analysis and Time Domain Waveform Patterns
- Thresholding and Prioritizing Bearing Maintenance Actions
- Building a Predictive Maintenance Program Around Bearing Diagnostics
Why Most Vibration Analysis Misses Early Bearing Damage
A process pump can run smoothly through several shifts while its bearing develops damage that a basic overall velocity trend barely registers. The route technician records a reading, compares it with the previous visit, and finds no dramatic change. Days later, the pump begins to heat, the seal starts leaking, and the bearing finally produces the familiar broadband vibration associated with advanced degradation.
By then, the bearing isn't the only concern. Raceway spalling, cage damage, shaft wear, and seal failure may already be developing. In a compressor train, a late intervention can also force an outage at a time determined by the machine rather than by the maintenance planner.
The problem is the difference between detecting vibration severity and diagnosing the mechanism causing it. Overall velocity is useful for judging general machine vibration, particularly when unbalance, looseness, or advanced mechanical damage produces substantial energy. It isn't a complete early-warning method for rolling-element bearing damage.
Practical rule: A stable overall trend doesn't prove that a bearing is healthy. It only proves that the selected measurement is not showing a significant change in that particular band under that operating condition.
The precursor conditions matter more than the final symptom
Contamination damages the lubricant film and creates localized impacts. Lubrication breakdown increases friction and removes the separation needed between rolling surfaces. Misalignment shifts the load toward an edge of the raceway, while an improper fit can introduce excessive clearance, preload, or creeping between mating surfaces.
These conditions can produce high-frequency energy, modulation, or changes in the time waveform before overall velocity rises sharply. A maintenance team that waits for a clear late-stage shock pattern has accepted a narrow intervention window. The more useful workflow looks for the signature of the damaging condition, not just the signature of collapse.
That approach is especially important because bearing faults are a major portion of rotating machinery failures. A study on bearing fault diagnosis reports that at least 30% of rotating machinery failures correspond to bearing faults. The diagnostic study describes how analysts use significant frequencies, amplitudes, and emerging spectral components to follow defect progression.
Why a workflow beats a perfect spectrum
Plant-floor data rarely resembles a clean training example. Pumps change flow, compressors move through operating points, motors run under variable-frequency drives, and structural resonances amplify some frequencies while hiding others. A magnetic sensor may also be positioned slightly differently from one inspection to the next.
The answer isn't to discard spectral analysis because the spectrum is messy. It's to establish a repeatable sequence:
- Confirm the machine's operating state and measurement point.
- Compare the current signal with a trusted baseline.
- Review overall acceleration and velocity, but don't stop there.
- Examine the spectrum for bearing-related frequency families.
- Use envelope analysis or another demodulation method when impacts are masked.
- Correlate the result with temperature, lubrication condition, alignment history, and process load.
- Assign an action based on asset criticality and defect progression.
A pump bearing with a developing outer-race defect on a noncritical service may justify a planned replacement. The same spectral behavior on a reactor circulation pump may require immediate operational planning, spare verification, and a controlled intervention window. Diagnosis and priority are separate decisions, and both must be made deliberately.
For teams formalizing severity evaluation, the practical relationship between machine vibration and standardized evaluation zones is outlined in this guide to ISO vibration standards. Standards support consistency, but they don't replace engineering judgment about the fault type or the consequence of failure.
Setting Up Your Bearing Vibration Measurement Workflow
Good interpretation starts before the analyzer records its first waveform. A poor measurement point, inconsistent sensor mounting, or inadequate frequency range can erase the very evidence needed to identify a developing bearing fault.
A motor-driven pump provides a useful example. The drive-end motor bearing, non-drive-end motor bearing, and pump bearing may all operate at the same running speed, but their load paths and structural responses differ. Each point needs a defined location, orientation, and acquisition setup.
Establish the measurement point
Mark the measurement locations on the asset drawing or route record. Use the same bearing housing or pedestal surface each time, and record whether the reading is radial horizontal, radial vertical, or axial.
- Radial directions: These usually reveal forces transmitted through the bearing and housing. Horizontal and vertical readings can differ substantially because of foundation stiffness, pipe strain, structural resonance, or gravity loading.
- Axial direction: This can expose thrust loading, angular misalignment, coupling problems, and some bearing installation issues. It shouldn't be treated as optional on thrust-sensitive equipment.
- Housing contact: Remove heavy paint, rust scale, and dirt from the contact area where practical. A sensor that rocks on an uneven surface can create a measurement artifact.
Magnetic mounts are fast, but they can lose high-frequency fidelity when the surface is rough or the magnet is not seated squarely. A stud-mounted accelerometer generally provides the most repeatable high-frequency transmission where permanent installation is justified. A well-seated adhesive mount can work for temporary studies, but the analyst should document the mounting method.
Teams working with delicate measurement environments may also benefit from understanding broader principles of vibration control for labs. The same basic lesson applies in an industrial route: control the measurement interface before interpreting the signal.
Configure acquisition for the fault you're looking for
The analyzer needs enough bandwidth to capture the expected bearing response and enough frequency resolution to separate meaningful components from nearby interference. A narrow frequency span may miss high-frequency impact energy. A very broad span with insufficient resolution may bury defect families in a crowded display.
Use a consistent setup for baseline and follow-up readings. Record the frequency span, lines of resolution, windowing, averaging method, sensor type, and operating speed. The exact settings depend on the bearing, machine, and diagnostic objective, but consistency is essential when the team is comparing subtle changes over time.
A practical route record should include:
- Operating condition: Speed, load, process state, and whether the machine is starting, stopping, or running steadily.
- Sensor orientation: Horizontal, vertical, or axial, with a photograph or marked diagram where ambiguity is likely.
- Mounting method: Stud, adhesive, magnetic, or another approved method.
- Signal types: Overall velocity, acceleration, spectrum, time waveform, and envelope spectrum where appropriate.
- Contextual observations: Temperature, lubrication activity, unusual noise, recent alignment work, and recent bearing replacement.
Protect the baseline from bad comparisons
A baseline collected at low load shouldn't be compared casually with a follow-up collected at full process load. Variable speed also shifts running-speed-related components and can alter the energy transmitted through the structure. If the operating state cannot be matched, the analyst should label the comparison as conditional rather than treating it as a clean trend.
The vibration analysis sensors used across a route should also be suitable for the frequency range and environment. Sensor selection is not just a hardware decision. It affects mounting, bandwidth, noise rejection, route time, and the confidence of every later interpretation.
Interpreting Spectral Signatures of Bearing Defects
A bearing spectrum becomes useful when its peaks are connected to bearing geometry, shaft speed, and failure physics. The analyst shouldn't identify a fault from a single peak alone. The location, harmonics, sidebands, amplitude pattern, time waveform, and operating condition must agree.
The four principal bearing fault frequencies are:
- BPFO, Ball Pass Frequency Outer race: The rate at which rolling elements pass a stationary outer-race defect.
- BPFI, Ball Pass Frequency Inner race: The rate at which rolling elements pass an inner-race defect.
- BSF, Ball Spin Frequency: The rotational frequency associated with a rolling element defect.
- FTF, Fundamental Train Frequency: The frequency associated with cage or retainer rotation.
Bearing manufacturers commonly provide these frequencies, or the analyst can calculate them from the number of rolling elements, pitch diameter, rolling-element diameter, contact angle, and shaft speed. The calculation must use the actual bearing and operating speed. A frequency match based on an incorrect bearing number can lead to an apparently convincing but wrong diagnosis.
What the spectrum can show
Early pitting may appear as weak energy around BPFO or BPFI with few harmonics. The signal can be easy to miss when the machine has strong gear mesh, electrical, or structural components. As a raceway defect grows, harmonics become more visible and the noise floor may rise.
An outer-race defect often produces repeated impacts at BPFO and its harmonics. An inner-race defect may show BPFI harmonics with sidebands related to shaft rotation because the defect moves through the loaded zone. Sidebands are additional peaks spaced around a principal frequency. They often indicate amplitude modulation, where the defect response changes as the damaged surface enters and leaves the load zone.
A rolling-element defect can produce BSF-related components, sometimes accompanied by cage-frequency sidebands. Cage wear may show FTF energy and unstable modulation, but low amplitude doesn't automatically mean low risk. A cage-related problem can progress differently from a raceway defect and should be correlated with lubrication, speed, and operating history.
Separate bearing faults from convincing false positives
Structural resonance can magnify an impact at a frequency unrelated to the defect frequency. The display may show a strong peak, but the peak belongs to the structure responding to an excitation rather than to the bearing's geometry. Electrical interference and drive-related components can also create narrow spectral lines that distract the analyst.
Contamination and lubrication problems may increase broadband energy rather than produce one clean defect peak. Misalignment can create harmonics and sidebands that overlap bearing-related families. This is why a spectrum should be compared with the time waveform, phase or directional information where available, temperature, and the mechanical history of the asset.
A peak is evidence, not a verdict. The diagnosis becomes credible when the frequency family, modulation pattern, physical condition, and operating context tell the same story.
NASA bearing diagnostics work found that raceway and cage damage generated structure-borne vibration in both low- and high-frequency ranges, while defects were more readily discerned at higher frequencies. The work identified 14 to 20 kHz as the most suitable detection range, with 20 to 29 kHz as an alternate range for faulty-bearing detection. The NASA technical report provides useful historical context for why high-frequency measurement deserves a place beside conventional velocity trending.
Envelope Analysis and Time Domain Waveform Patterns
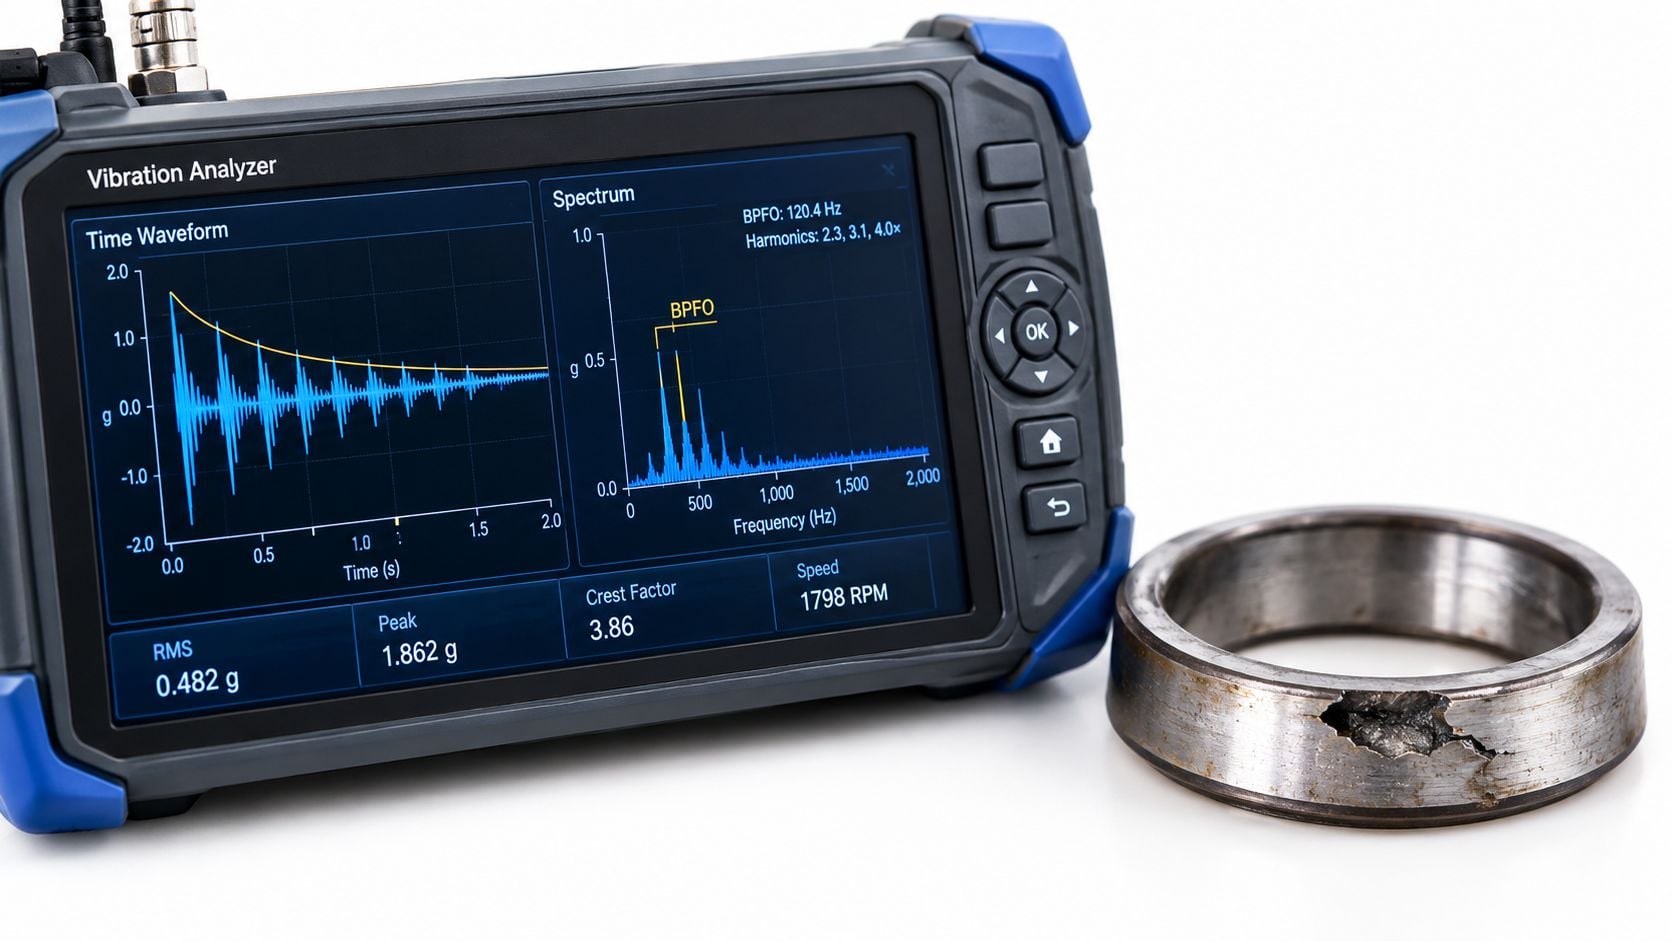
Overall velocity answers a broad question: how much low- and mid-frequency vibration is the machine producing? Acceleration responds more readily to high-frequency impacts, but acceleration RMS can still conceal repetitive bearing impacts inside a complex machine signal. Envelope analysis addresses that problem by isolating a resonant frequency band and demodulating the impacts that excite it.
When a roller passes over a localized defect, it creates a short impulse. That impulse excites a natural frequency in the bearing, housing, or nearby structure. The envelope process filters the selected high-frequency band, removes the carrier behavior, and reveals the repetition rate of the impacts. BPFO, BPFI, BSF, or FTF can then become visible even when the raw spectrum is crowded.
Choose the measurement for the decision
Overall velocity works well for judging general machine severity and following substantial changes in many rotating assets. It is less dependable as a standalone early bearing indicator, particularly when damage produces short, high-frequency impacts without much overall energy.
Acceleration RMS is more responsive to high-frequency activity and can help identify changes that velocity overlooks. It still compresses the waveform into a summary value, so it doesn't tell the analyst whether the energy comes from a bearing defect, gear contact, looseness, or another source.
Envelope analysis is strongest when repetitive impacts are the key diagnostic evidence. It requires sensible filter selection and a trustworthy bearing-frequency calculation. A poorly selected band can amplify structural resonance, gear mesh interference, or random process noise instead of the bearing response.
Read the waveform, not only the envelope spectrum
An early defect may produce isolated, repeating impacts in the time waveform. As damage progresses, impacts can become more frequent, stronger, and less distinct. Advanced degradation may appear as rough, densely packed activity with a raised background rather than a neat sequence of separated shocks.
Mechanical looseness can also generate impulsive waveforms. Gear mesh interference may create periodic events that resemble bearing impacts. The analyst should check whether the repetition rate matches the bearing geometry and whether the signal changes with speed, load, or process condition.
In a chemical processing pump, for example, a modest overall velocity trend may coexist with a growing envelope peak at the calculated inner-race frequency. If the peak appears with shaft-speed sidebands and the time waveform shows repeated impacts, the maintenance decision should focus on confirming the inner-race condition, checking alignment and fit, and planning replacement before seal or shaft damage develops.
Sound and ultrasound can add another perspective when high-frequency mechanical activity is difficult to isolate. Guidance on acoustic monitoring is useful when teams are deciding whether vibration should remain the only condition signal on a critical asset. The strongest program often uses vibration as one layer of evidence rather than expecting one measurement to answer every question.
Thresholding and Prioritizing Bearing Maintenance Actions
A vibration alarm has value only when it leads to a timely and appropriate action. Many programs fail because they treat the alarm limit as the diagnosis. A threshold can indicate that a measurement deserves attention. It cannot, by itself, determine whether the team should lubricate, align, inspect, replace, reduce load, or continue operating under controlled risk.
ISO 20816-1 evaluates vibration severity at each bearing or pedestal by comparing the maximum measured vibration magnitude with four evaluation zones derived from international experience. The ISO 20816-1 reference gives teams a standardized basis for judging whether a machine is operating normally, needs closer observation, or requires corrective action.
Use two kinds of thresholds
Absolute thresholds provide a common severity language across assets with comparable configurations. They help identify machines that are operating at an unacceptably high level even when the trend history is incomplete.
Trend thresholds answer a different question. A bearing that rises steadily from its established baseline may deserve attention before it reaches a general severity boundary. Conversely, a machine with a stable but relatively high reading may require a different response from one showing rapid deterioration.
A practical alarm record should capture:
- Severity level: The current measurement and applicable evaluation zone.
- Rate of change: Whether the signal is stable, rising, intermittent, or accelerating.
- Fault evidence: Defect frequencies, harmonics, sidebands, envelope behavior, and waveform impacts.
- Operating context: Speed, load, temperature, process state, and recent interventions.
- Required action: Recheck, lubricate, inspect, align, plan replacement, or shut down under an approved procedure.
Rank risk, not just vibration amplitude
Suppose three assets show developing bearing indications. A small induced-draft fan may have a clear defect but low production consequence. A process feed pump may show a weaker indication but threaten a continuous production line. A standby motor may have raised vibration yet remain available as a redundant unit.
Priority should combine severity, confidence, consequence, and response time. Criticality ranking should consider safety, environmental exposure, quality, production constraints, redundancy, spare availability, and the potential for secondary damage. The highest amplitude isn't always the highest business risk.
The work order should state what the analyst knows and what remains uncertain. “Replace bearing” is incomplete if contamination caused the damage. “Inspect lubrication path, seal condition, shaft fit, and alignment before installing replacement bearing” gives the maintenance team a chance to remove the failure mechanism.
Oil evidence can strengthen that decision. A targeted oil sampling analysis program can help distinguish lubricant degradation or contamination from a purely mechanical fault, particularly on gearboxes, circulating-oil systems, and lubricated process equipment.
Close the loop after intervention
After lubrication, alignment, or bearing replacement, repeat the measurement under a comparable operating state. A successful intervention should change the relevant spectral or envelope evidence, not merely produce a new route reading.
Retain the before-and-after spectrum, waveform, work order, parts information, and teardown findings. If the removed bearing shows fluting, edge loading, contamination, or cage damage, update the failure code and inspection task. The feedback loop turns an isolated diagnosis into a more reliable maintenance standard.
Building a Predictive Maintenance Program Around Bearing Diagnostics
Bearing analysis works best as part of a decision system. Vibration identifies mechanical behavior, while temperature, oil condition, ultrasound, thermography, motor current, operating data, and inspection findings add context. The combination helps teams distinguish a bearing defect from the condition that created it.
Route-based inspections remain practical for many assets, especially where failure progression is slow and criticality is moderate. Continuous monitoring deserves consideration for equipment that operates continuously, has limited redundancy, or can create substantial secondary damage. A hybrid program usually gives maintenance planners better coverage than forcing every asset into one monitoring format.
The program also needs a clear path from evidence to work. Sensor data should enter a controlled review process, analysts should document confidence and recommended action, and planners should connect the recommendation to spares, access, permits, production constraints, and follow-up measurements. Teams assessing the wider relationship between condition data and business systems can review guidance on predictive analytics for ERP operations.
Forge Reliability provides vibration analysis, condition monitoring, oil analysis, thermography, ultrasound, motor current analysis, and reliability consulting for rotating equipment. Its vibration analysis tools can support route-based and continuous diagnostic workflows when a plant needs additional capability or specialist analysis.
A mature bearing program doesn't collect more data for its own sake. It catches the right signal, explains the likely failure mechanism, assigns a risk-based action, and verifies that the repair removed the cause.
Forge Reliability can assess a plant's bearing failure risks, measurement practices, alarm logic, and maintenance response through a free reliability assessment. Visit Forge Reliability to discuss a practical vibration analysis program for critical pumps, motors, compressors, gearboxes, and other rotating assets.