A maintenance manager arrives at a chemical plant and inherits a predictive program with years of vibration routes, oil reports, and thermal images. The data exists, but nobody can explain which reading triggers a work order, which alarm can wait, or why a critical pump still failed without warning. That gap is common, and it's expensive. NIST's manufacturing machinery maintenance analysis puts average annual maintenance related costs and losses across US manufacturing at $222.0 billion, while establishments in the highest predictive maintenance group among lower reactive users recorded 15% less downtime, an 87% lower defect rate, and 66% less inventory growth from unplanned maintenance.
An effective predictive maintenance checklist doesn't treat every machine the same. It ties each critical asset to a failure mode, a measurement technology, a collection frequency, an alarm threshold, and a planned response in the CMMS, which is the computerized maintenance management system used to manage work orders. Asset identity matters as much as sensor data, and how Evright Industrial helps with asset tracking illustrates why clean hierarchies and tags support reliable trending. The eight items below work as a field program, starting with rotating equipment diagnostics and ending with performance degradation that vibration alone won't catch.
Table of Contents
- 1. Route-Based Vibration Analysis Bearing Imbalance and Misalignment Checks
- 2. Oil Analysis Wear Debris Contamination and Lubricant Health Monitoring
- 3. Infrared Thermography Electrical Hotspot and Mechanical Heat Survey
- 4. Airborne and Structure-Borne Ultrasound Bearing Lubrication and Leak Detection
- 5. Motor Current Signature Analysis Rotor Bar Eccentricity and Load Diagnostics
- 6. Laser Shaft Alignment and Soft Foot Verification for Rotating Equipment
- 7. Steam Trap Survey and Steam System Leak Assessment
- 8. Pump and Compressor Performance Trending Efficiency Head and Flow Degradation
- 8-Point Predictive Maintenance Checklist Comparison
- Turning This Checklist Into a Working Reliability Program
1. Route-Based Vibration Analysis Bearing Imbalance and Misalignment Checks
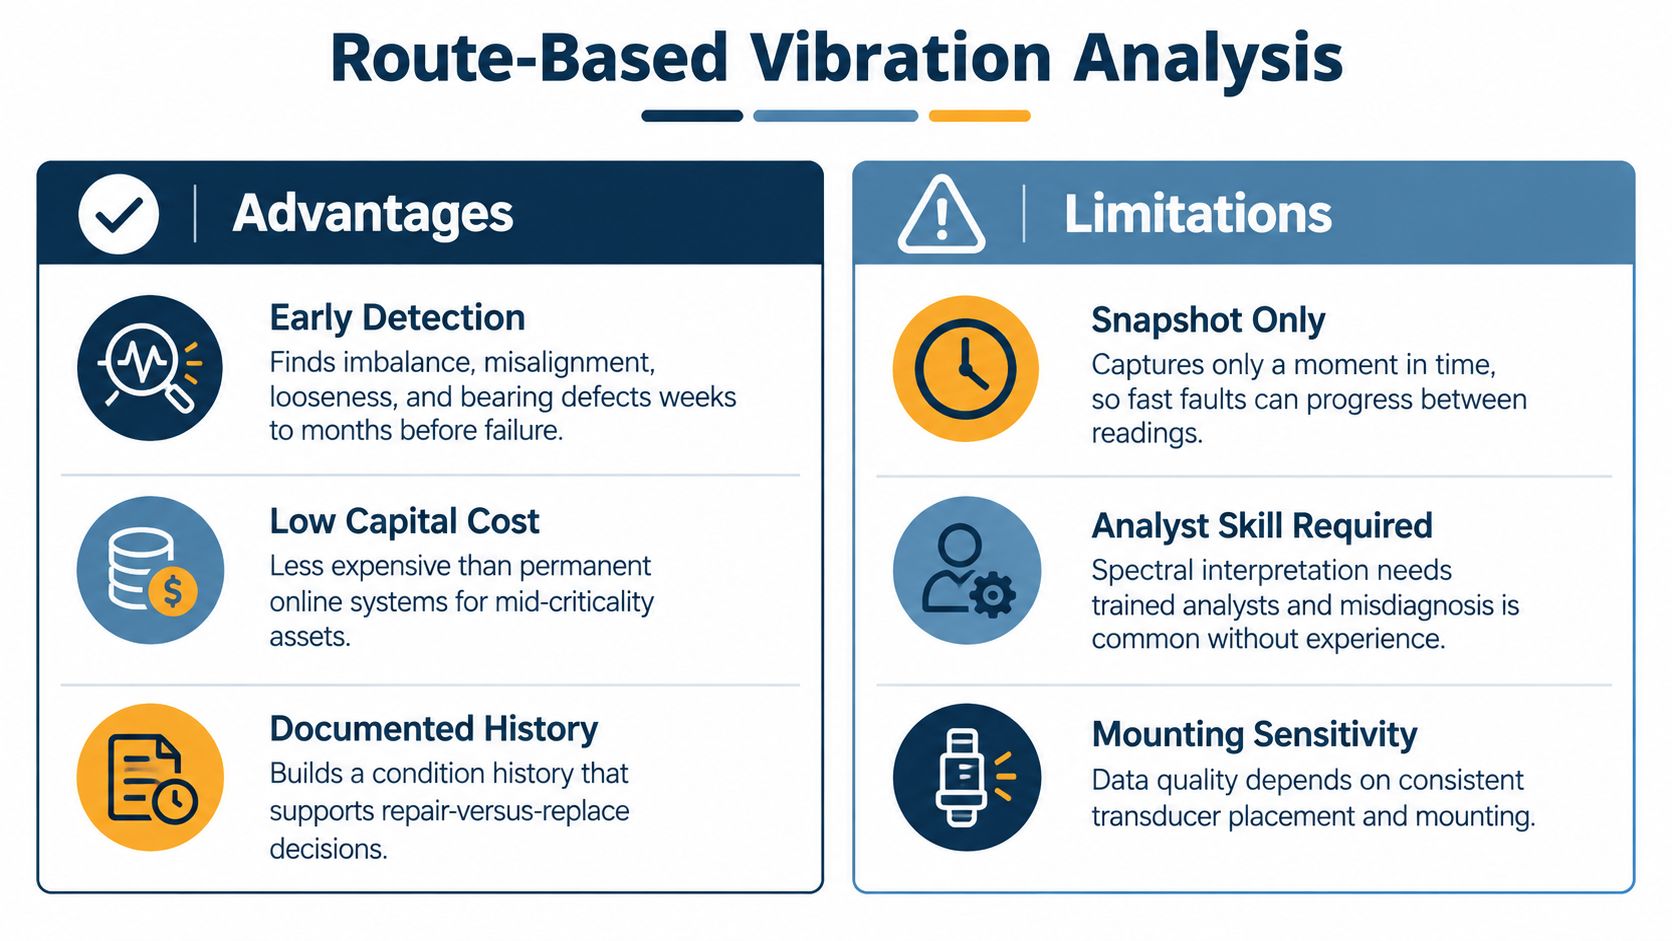
Route-based vibration analysis uses a portable analyzer and accelerometer, a sensor that measures acceleration, at fixed points on pumps, fans, motors, and gearboxes. Technicians trend overall velocity against severity zones and then examine the FFT spectrum, a fast Fourier transform plot that separates vibration into individual frequencies. That second step matters, because an overall alarm detects a problem without diagnosing it. Guidance on zone boundaries and machine grouping sits in Forge Reliability's overview of ISO vibration standards, and limits should still be tuned to each asset's baseline.
Reading the Fault Signatures
Imbalance concentrates energy at 1x running speed, while misalignment typically raises 2x and axial vibration. Bearing damage appears at defect frequencies such as BPFO for outer race faults and BPFI for inner race faults, often clearer in envelope acceleration than in overall velocity. Looseness can produce sub-harmonics, as seen on a paper mill fan where a loosened foundation bolt created peaks at fractions of running speed.
- Fixed measurement points: Mark locations with paint or studs so repeatability doesn't depend on who holds the sensor.
- Operating context: Record speed, load, flow, and temperature with every reading, since process state changes vibration.
- Asset specific alarms: Set warning and danger levels by machine class and confirmed baseline, not one plant-wide number.
- Confirmation before repair: Pair a suspect spectrum with ultrasound or oil analysis before authorizing costly work.
On a 150 kW centrifugal pump at a water treatment plant, a rising BPFO peak and envelope trend across four route visits gave planners enough lead time to replace the bearing during a scheduled shutdown. The route interval has to be shorter than the P-F interval, the time between a detectable potential failure and functional failure. If a fault can develop faster than the route returns, that asset belongs on continuous monitoring instead of a monthly walkaround.
2. Oil Analysis Wear Debris Contamination and Lubricant Health Monitoring
A cement kiln fan gearbox tells the story well. Iron in the oil climbed steadily across three samples, and particle inspection identified fatigue spalling, small flakes breaking away from a rolling surface. Inspection confirmed gear damage before a tooth failed and took the drive with it. Oil analysis earned its place on the checklist because it sees inside sealed gearboxes, hydraulic systems, compressors, and turbines that vibration can't fully characterize.
Laboratories report three categories. Wear metals show which components are shedding material, contamination covers water, dirt, and particle counts, and lubricant health covers viscosity change, oxidation, and acid number. Forge Reliability's oil sampling and analysis guidance details how sample quality controls whether those results mean anything at all. A sample pulled from a drain after shutdown mostly describes settled debris, not the oil that was protecting the gears.
Sampling Discipline That Protects the Trend
- Live sampling point: Draw from turbulent flow upstream of the filter through a dedicated valve while the machine runs.
- Consistent interval and lab: Changing laboratories breaks trend comparability and hides slow wear.
- Combined indicators: Read wear metals alongside particle counts, because a fresh filter can mask rising debris.
- Criticality based priority: Sample high consequence gearboxes and hydraulics first rather than spreading budget evenly.
Field rule: A single alarming sample earns a resample and inspection. A confirmed three sample trend earns a planned work order.
Contamination findings pay back quickly too. In a food plant hydraulic press, elevated water traced back to a leaking heat exchanger, and fixing the seal addressed the cause rather than repeatedly changing oil. Teams reviewing lubricant selection can cross-check basics in this lubricant guide for machinists, then confirm viscosity and additive requirements against the equipment manufacturer's specification before substituting products.
3. Infrared Thermography Electrical Hotspot and Mechanical Heat Survey
Infrared thermography measures surface temperature without contact using a radiometric camera, an instrument that records temperature at every pixel. Loose electrical connections heat up because resistance converts current into wasted thermal energy, so switchgear, motor control centers, and disconnects reveal problems while still energized. Mechanical surveys use the same camera differently, looking for bearing friction, coupling distress, and blocked cooling passages.
The diagnostic value sits in delta T, the temperature difference between a suspect component and a comparable reference under similar load. A survey of a 480 V motor control center found a large delta T across one breaker lug compared with its sister phases. Crews torqued the connection during a planned window, removing a hotspot that carried arc flash risk. At a cement plant, a raw mill drive coupling ran noticeably hotter than its twin drive, which pointed the inspection straight at the failing element.

Conditions That Make Images Comparable
Thermographers adjust for emissivity, a surface property that affects how accurately the camera reads temperature, and painted steel behaves very differently from polished metal. Surveys also need real load, since a lightly loaded connection may not heat enough to show its resistance. Forge Reliability's thermography inspection services standardize severity classification so findings translate into prioritized electrical work rather than a folder of color images.
- Documented load: Record operating load on every image so routes stay comparable.
- Phase comparison: Judge components against identical phases or sister equipment first.
- Repeatable setup: Use consistent distance, angle, and camera settings each route.
- Safety coordination: Plan energized surveys around electrical safety procedures and qualified personnel requirements.
Thermography's limitation is honesty about access. It can't see through closed, unwindowed enclosures, and it can't diagnose a fault that produces no surface heat. That's why it complements vibration and ultrasound rather than replacing them.
4. Airborne and Structure-Borne Ultrasound Bearing Lubrication and Leak Detection
Ultrasound instruments listen above the range of human hearing, where friction, turbulence, and electrical discharge produce distinct signals. Structure-borne ultrasound uses a contact probe on bearing housings, while airborne ultrasound uses a directional receiver to locate compressed air, steam, and vacuum leaks. The technology earns special value on slow speed bearings, where vibration energy is weak but friction noise shows up early.
A refrigeration plant route caught a rising decibel trend on a screw compressor motor bearing before housing temperature moved. Technicians corrected lubrication while monitoring the reading, and the bearing returned to baseline without a motor change. That procedure, called ultrasonic lubrication, charges grease in small shots while watching the signal fall. It prevents the two most common greasing errors at once, starving the bearing and overpacking it until seals and heat suffer.
Building a Route That Technicians Trust
- Bearing baselines: Establish a reference decibel level for each bearing under normal load.
- Consistent technique: Use the same probe, contact point, and pressure every visit.
- Grease to the signal: Stop charging when readings return to baseline instead of applying a fixed volume.
- Tagged leak value: Attach an estimated annual energy cost to each leak so repairs compete fairly for budget.
Leak surveys often fund the rest of the program. A pharmaceutical plant compressed air survey found a large population of small leaks, and repairs measurably reduced compressor run time. Forge Reliability's ultrasonic leak detection work applies the same instruments to steam traps and bearing routes. Ultrasound won't identify which internal bearing component is damaged, though. When decibels keep climbing after correct lubrication, vibration spectrum analysis should confirm the defect before planners schedule the replacement.
5. Motor Current Signature Analysis Rotor Bar Eccentricity and Load Diagnostics
Motor current signature analysis, or MCSA, reads faults from the spectrum of current feeding an induction motor. Because rotor and stator interact electromagnetically, mechanical and electrical defects modulate that current and create sidebands, small peaks spaced around the supply frequency. Analysts need accurate nameplate data and slip, the small difference between synchronous and actual rotor speed, before interpreting those patterns. Forge Reliability's electrical fault detection services combine current data with vibration so one ambiguous signal doesn't drive a motor pull.
Broken or cracked rotor bars produce a characteristic sideband pattern tied to slip frequency. A 300 hp boiler feed pump motor at a power plant showed exactly that signature, and inspection during a planned outage confirmed the rotor damage before it progressed to a forced trip. Air gap eccentricity, meaning the rotor isn't centered in the stator bore, creates a different family of components that analysts separate from load effects.
Where Current Analysis Outperforms Sensors on the Machine
MCSA shines where mounting vibration sensors is impractical, including hazardous areas, submerged pumps, and equipment behind guards. Because the motor feels driven load, current variation can also expose process problems. A water utility used that principle on raw water pumps, where load related current changes pointed to cavitation, vapor bubbles forming and collapsing in the pump, and operators adjusted suction conditions before impeller damage followed.
- Load and voltage record: Capture both with every measurement, since imbalance and low load distort interpretation.
- Calculated slip: Verify speed against nameplate data before judging sideband spacing.
- Drive awareness: Apply different methods to variable frequency drive output than to fixed line supply.
- Cross confirmation: Support major motor decisions with vibration or thermographic evidence.
The trade-off is sensitivity to operating state. A motor cycling under process control produces a messy spectrum, and honest analysts reject bad data instead of forcing a diagnosis from it.
6. Laser Shaft Alignment and Soft Foot Verification for Rotating Equipment
Alignment isn't strictly a monitoring technology, yet it belongs on every predictive maintenance checklist because it removes a root cause that other tools keep rediscovering. Misalignment loads couplings, bearings, and seals, and it announces itself through elevated 2x vibration and shortened component life. Laser systems mount sensors on both shafts and calculate vertical and horizontal offset and angle as the shafts rotate.
Soft foot means one machine foot doesn't sit flat on the baseplate, so tightening the bolts distorts the frame. Correcting alignment on top of an uncorrected soft foot produces numbers that look acceptable cold and drift in service. A 500 kW petrochemical compressor drive combined angular misalignment with a soft foot condition, and correcting both together cut the 2x component dramatically. Treating either fault alone would've left the machine distressed.

Checks Before Accepting an Alignment Result
- Soft foot first: Verify every foot sits flat and correct shimming before measuring shaft position.
- Pipe strain test: Loosen flange bolts and watch for shaft movement that reveals piping pulling the machine.
- Thermal growth allowance: Apply manufacturer growth offsets or verify alignment hot on high temperature services.
- As-found and as-left records: Store both in the CMMS so recurring drift becomes visible across outages.
Repeat coupling failures on the same drive train usually aren't a coupling problem. They're an alignment, soft foot, or pipe strain problem wearing a coupling disguise.
A food plant conveyor drive stopped eating couplings after laser alignment combined with pipe strain relief. The lesson generalizes. When the same failure repeats, the checklist should force a mounting and alignment review instead of another like for like parts swap.
7. Steam Trap Survey and Steam System Leak Assessment
Steam traps discharge condensate while holding back live steam, and they fail in two expensive directions. A failed-open trap blows steam straight into the condensate system, wasting fuel continuously. A failed-closed trap floods heat exchangers, kills heat transfer, and risks water hammer, the pressure shock created when condensate slugs accelerate through piping. Neither failure stops production immediately, which is exactly why trap populations degrade for years.
Surveys combine methods because trap types behave differently. Ultrasound reveals the sound pattern of cycling, leaking, or silent traps, while thermography compares inlet and outlet temperatures. A food processing plant survey covering 260 traps identified 47 failed-open units, and repairs produced a noticeable drop in boiler fuel consumption. At a refinery, one failed-closed trap on a heat exchanger train explained a process temperature shortfall that operations had been chasing as a fouling problem.
Turning Trap Findings Into Funded Work
- Tagged population: Map every trap in the CMMS with type, size, location, and design pressure.
- Two method diagnosis: Confirm suspect traps with ultrasound and temperature together to reduce misclassification.
- Costed losses: Convert steam loss into annual fuel cost using actual boiler efficiency so repairs rank by payback.
- Risk based frequency: Survey critical process traps more often than comfort heating traps.
Trap type knowledge matters during diagnosis. Thermodynamic, thermostatic, float, and inverted bucket traps each produce distinct operating sounds and temperature profiles, and a surveyor applying one template to all four will mislabel good traps as failed. The checklist should also capture application errors, since an undersized or wrongly selected trap fails repeatedly no matter how often crews replace it. Annual surveys suit most plants, with quarterly attention where steam costs or process criticality run high.
8. Pump and Compressor Performance Trending Efficiency Head and Flow Degradation
Some degradation never raises vibration until it's advanced. Performance trending catches it earlier by comparing a machine's actual output against its original curve. For centrifugal pumps, technicians trend flow, differential head, and power input, then calculate hydraulic efficiency at a consistent duty point. Falling efficiency at constant duty usually means impeller wear, enlarged internal clearances, or suction restriction.
A 75 kW boiler feed pump at a chemical plant lost roughly ten points of hydraulic efficiency over fourteen months while vibration stayed unremarkable. Internal inspection found wear ring clearance at twice the design limit, and replacing the rings during a planned outage recovered meaningful electrical energy. Compressors follow the same logic with pressures, temperatures, and polytropic efficiency, a measure of compression effectiveness. At a gas processing plant, declining compressor efficiency with rising discharge temperature traced to a fouled intercooler, and cleaning restored performance without opening the machine.
Normalizing Data So Trends Stay Honest
- Consistent duty points: Compare readings at matched flow and head, and flag process changes that shift the operating point.
- Calibrated instruments: Verify flow meters, pressure transmitters, and power meters before building the baseline.
- Affinity law correction: Normalize pump data when speed varies, and document the method used.
- Mechanism confirmation: Pair performance loss with vibration or oil evidence before opening equipment.
Performance trending carries a data quality warning. Survey evidence in the IFS State of Service in Manufacturing 2025 report found data quality, governance, or availability was an issue for 41% of UK respondents, despite 94% of manufacturers experiencing unexpected downtime. Drifting transmitters create phantom efficiency losses, so calibration records belong on the checklist beside the trend itself. When instruments are trustworthy, performance data often makes the clearest economic case for intervention, expressed in energy cost rather than abstract machine health.
8-Point Predictive Maintenance Checklist Comparison
| Method | Implementation Complexity | Resource Requirements | Expected Outcomes | Ideal Use Cases | Key Advantages |
|---|---|---|---|---|---|
| Route-Based Vibration Analysis | Moderate; repeatable routes and trained spectral analysts required | Portable analyzer, accelerometer, fixed measurement points, trend database | Early identification of imbalance, misalignment, looseness, and bearing defects | Rotating equipment where periodic checks are sufficient | Lower cost than permanent monitoring; builds condition history |
| Oil Analysis | Moderate; sampling procedures and lab-result interpretation required | Sampling equipment, laboratory testing, consistent sampling schedule | Identifies wear, contamination, and lubricant degradation | Gearboxes, hydraulic systems, engines, and other oil-lubricated assets | Detects contamination causes and wear that may not appear in vibration data |
| Infrared Thermography | Low to moderate; accurate readings require camera setup and survey procedures | Radiometric thermal camera, trained inspector, access under suitable operating load | Reveals electrical hotspots and abnormal mechanical heating | Energized electrical systems, switchgear, motors, and large-area surveys | Non-contact inspection; surveys large areas quickly |
| Airborne and Structure-Borne Ultrasound | Low to moderate; consistent probe placement and baselines needed | Portable ultrasonic instrument, contact or airborne sensors, headphones | Detects early bearing stress, lubrication issues, and fluid or gas leaks | Bearings, compressed-air systems, steam systems, and vacuum lines | Quick measurements; finds energy-wasting leaks and early lubrication problems |
| Motor Current Signature Analysis | Moderate to high; motor and electrical analysis expertise required | Current transducers, analyzer or software, motor data, load and voltage readings | Identifies rotor-bar, eccentricity, and load-related faults | Motors that are hazardous, inaccessible, or difficult to instrument mechanically | Monitors motors without access to driven components |
| Laser Shaft Alignment and Soft Foot Verification | Moderate; setup, correction, and thermal-growth considerations required | Laser alignment system, shims, stable foundation, trained technician | Corrects shaft misalignment and soft foot, reducing coupling and bearing stress | Coupled motor, pump, and compressor drive trains | Provides measurable alignment verification and can reduce repeat failures |
| Steam Trap Survey and Steam System Leak Assessment | Moderate; large systems require substantial survey and data management | Ultrasonic and thermal tools, trap inventory, loss-estimation data | Finds failed traps and quantifies steam and energy losses | Steam distribution systems, heat exchangers, and process plants | Can reduce fuel use, emissions, and operating costs |
| Pump and Compressor Performance Trending | High; measurements must be reliable and operating conditions normalized | Flow, pressure, temperature, and power instrumentation; OEM curves or baseline data | Identifies efficiency loss, internal wear, and performance degradation | Pumps and compressors with measurable operating data | Quantifies energy waste and supports repair or operating-point decisions |
Turning This Checklist Into a Working Reliability Program
Eight technologies don't make a program. The structure around them does, and that structure starts with asset criticality ranking, which scores equipment by production, safety, quality, and replacement consequences. Criticality decides which pumps get continuous monitoring, which gearboxes get quarterly oil samples, and which low consequence assets stay on operator rounds. A formal failure modes and effects analysis, described in NIST's FMEA and reliability guidance, then maps each failure mode to its detectable precursor so monitoring spending follows actual failure physics.
Adoption data argues for staging rather than plant-wide instrumentation on day one. MaintainX's 2025 survey of 1,320 maintenance professionals found only 27% of facilities actively employed predictive maintenance, down from 30% the prior year, while 71% reported preventive maintenance in their strategy. Maturity research points the same direction. S&P Global Market Intelligence's 2024 condition-based maintenance study classified just 15% of respondents as predictive users, compared with 24% proactive and 41% responsive.
A Practical Twelve Month Rollout
The first quarter belongs to criticality analysis, CMMS cleanup, and failure mode registers for the top tier assets. Routes launch next on those assets, with baselines captured after commissioning or verified repairs. Expansion follows only after the alert to work order loop proves itself, because scaling a broken workflow just manufactures ignored alarms faster. Scheduling discipline underpins all of it, and Blue Gas Express maintenance scheduling advice reinforces how planned windows protect both production and repair quality.
Alarm design deserves the same rigor as sensor selection. NIST's prognostics and health management framework frames predictive maintenance as acting when a reliability indicator reaches a predetermined level, which means every threshold needs a defined response. Continue monitoring, confirm with a second technology, plan a work order, reduce load, or shut down. The standards backbone supports that discipline too, since ISO 13381-1 machine prognostics guidance structures the work as detection, diagnosis, forecasting, recommendation, and post-maintenance review.
Measurement should focus on decisions, not data volume. Track alert precision, median warning lead time, emergency work percentage, confirmed failure mechanisms, and post-repair recurrence alongside MTBF, which is mean time between failures. Monthly reviews of false alarms, missed detections, and completed recommendations keep thresholds honest. Plants that skip the post-repair verification reading never learn whether the diagnosis was right, and their predictive maintenance checklist stays a data collection exercise instead of becoming a reliability system.
Forge Reliability engineers design asset specific predictive programs covering vibration, oil analysis, thermography, ultrasound, and motor current diagnostics for pumps, motors, gearboxes, and steam systems. Plants can request a free reliability assessment to map these eight checklist items to their highest consequence equipment and prioritize the fastest reductions in unplanned downtime. Start the conversation at Forge Reliability.