
The popular advice says to buy sensors first and let the software find the problems. That's backwards. Sensors don't prevent failures. Decisions do. A condition monitoring predictive maintenance program works when a measured symptom is tied to a named failure mode, a threshold a planner trusts, and a work order that can be scheduled before secondary damage starts. Without that chain, plants just collect trend charts while pumps, motors, and gearboxes keep failing on their own schedule.
Table of Contents
- How Condition Monitoring Fits Inside Predictive Maintenance
- Monitoring Techniques and the Faults Each One Catches
- Selecting Failure Modes and Monitoring Format by Criticality
- Why Predictive Programs Stall After Sensors Go In
- KPIs That Prove Predictive Maintenance Is Paying Off
- Launch Your Program and Book a Free Reliability Assessment
How Condition Monitoring Fits Inside Predictive Maintenance
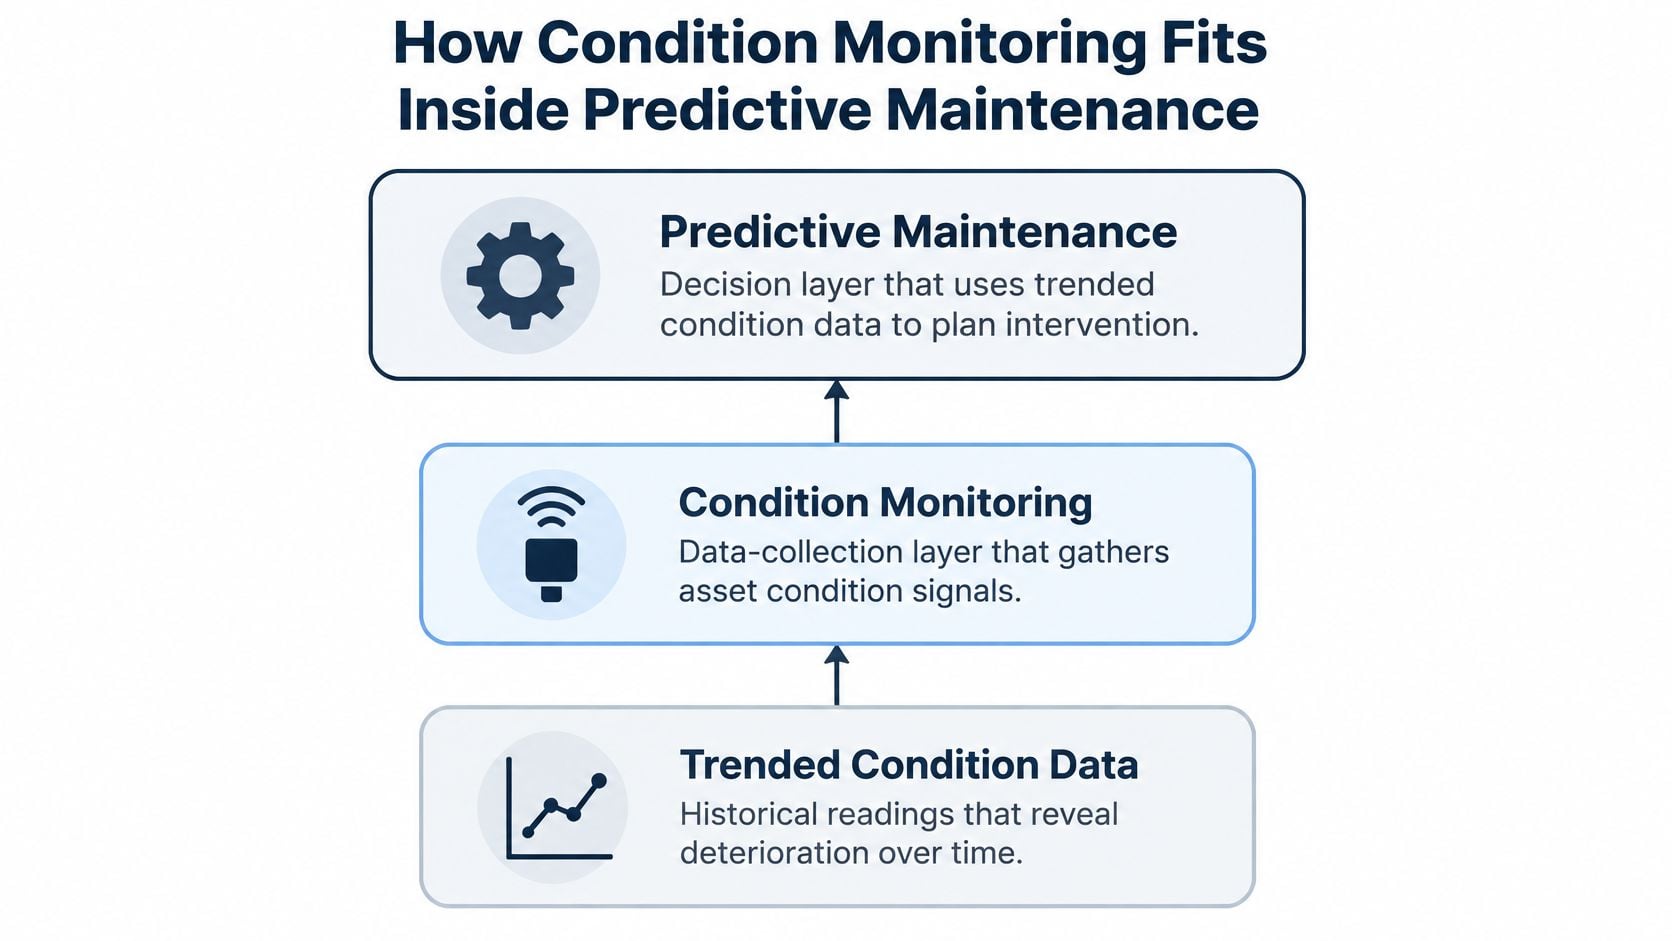
Sensors do not define a maintenance strategy. The strategy comes from deciding which failures matter, what evidence can detect them, and what action the evidence should trigger.
Condition monitoring gathers equipment data through techniques such as vibration analysis, oil analysis, thermography, ultrasound, and motor current signature analysis. Predictive maintenance uses that information to assess developing faults and plan maintenance before failure. Together, they form a decision system: measurements need defined thresholds, assigned responsibility, and a route into maintenance planning.
A physician uses readings such as temperature and blood pressure to guide a diagnosis and treatment. Plant teams face the same distinction: a measurement is useful only when it changes a maintenance decision. Choose the strategy by asset consequence and failure detectability.
Four Strategies by Trigger
| Strategy | Trigger for work | Data used | Best suited to |
|---|---|---|---|
| Reactive | Failure occurs | None before failure | Low-consequence, inexpensive assets |
| Preventive | Fixed calendar or run hours | Usage counters and OEM intervals | Items with well-characterized wear, such as motor brushes and packing seals |
| Condition-based | Measured value crosses a set limit | Periodic readings compared with alarm limits | Assets with a measurable symptom but no forecast need |
| Predictive | Trend forecasts a failure window | Trended condition data, history and process variables | Critical rotating equipment with a defined failure mode |
Condition-based maintenance triggers work when a reading crosses a limit; predictive maintenance uses trends to estimate a failure window. See the explanation of condition-based maintenance versus predictive maintenance. In practice, plants often use predictive maintenance on critical rotating equipment and preventive maintenance on simpler assets. For broader context on connecting technology with operational results, see measurable AI outcomes for operations leaders.
What the Benchmarks Show
The National Institute of Standards and Technology summary reports that maintenance activity across surveyed U.S. establishments was 17.3% predictive, 31.8% preventive, and 45.7% reactive. The same summary reports that facilities relying more heavily on predictive maintenance had 15% less downtime and an 87% lower defect rate than comparable preventive-heavy facilities. It also reports 52.7% less unplanned downtime and 78.5% fewer defects for the stronger predictive-and-preventive group compared with the weakest group.
The NIST summary estimates annual maintenance-related costs and losses in U.S. manufacturing at approximately $222.0 billion. These industry-level findings are not a forecast for an individual plant. They do show why maintenance strategy affects availability, quality, and cost, and why teams need to match the approach to the asset and the failure mode.
Monitoring Techniques and the Faults Each One Catches
Start with a centrifugal process pump that's getting louder. Overall vibration says something's wrong, but it doesn't say what. Rising broadband vibration may indicate cavitation, which is vapor bubbles collapsing in the pump and eroding the impeller. A discrete peak at running speed points toward imbalance or misalignment instead. Those faults need completely different repairs, so the spectrum, not the overall level, drives the decision.
NASA's Reliability-Centered Maintenance guidance lists imbalance, shaft misalignment, mechanical looseness, bearing damage, belt and pulley defects, gear damage, flow turbulence, pump cavitation, structural resonance, and fatigue as detectable by vibration analysis. The method compares each measurement with a baseline captured while the machine operates correctly. NASA also states vibration monitoring can provide several weeks or months of warning before impending failure, though speed, load, sensor location, fault progression, and data quality set the actual interval.
Matching Technique to Fault
| Technique | Detects | Typical equipment | Interpretation note |
|---|---|---|---|
| Vibration analysis | Imbalance, misalignment, looseness, bearing and gear damage, cavitation, resonance | Pumps, motors, compressors, gearboxes, fans | Use the spectrum, not overall level, to isolate the cause |
| Oil analysis | Wear debris, contamination, lubricant degradation | Gearboxes, hydraulic systems, turbine lube oil | Trend results between samples |
| Thermography | Hot electrical connections, friction heat, insulation hot spots | Motor control centers, motors, bearing housings | Compare surface temperature with a baseline under the same load |
| Ultrasound | Early bearing friction, lubrication shortage, air or steam leaks, arcing | Bearings, valves, steam traps, electrical gear | Detects high-frequency noise before vibration changes |
| MCSA | Rotor bar damage, eccentricity, supply imbalance, load problems | Electric motors driving pumps and fans | Non-contact; read current signature trends against load |
Each technique earns its place by revealing something the others miss:
- Oil analysis: Wear metals and particle counts identify which component is shedding material, and oxidation or water shows lubricant degradation before friction rises.
- Thermography: Infrared images expose loose electrical connections and friction heat. Load and emissivity affect readings, so technicians benefit from guidance on adjusting thermal imaging camera settings before comparing images.
- Ultrasound and shock-pulse checks: High-frequency energy rises when rolling elements strike a defect or run short of lubricant, often before a low-frequency spectrum changes on a high-speed compressor or motor drive.
- Motor current signature analysis (MCSA): Current patterns reveal broken rotor bars and eccentricity without mounting a sensor on the motor. Teams comparing instruments can review vibration analysis tools for route and continuous options.
Lead Time Is the Real Test
Say a steam turbine journal bearing shows rising vibration at running speed. The analyst reads the trend against a healthy baseline and checks the spectrum and oil results to separate imbalance from bearing wear or lubrication failure. That interpretation decides whether the job is balancing, an oil change, or a bearing replacement.
A technique is only useful if it detects a fault early enough to plan the repair.
That gap is the P-F interval, the time between a detectable potential failure and functional failure. Predictive maintenance catches roughly 80% of mechanical failures with 200 to 1,500 hours of lead time, depending on the failure mode. Inspection frequency must sit comfortably inside that interval, or faults will progress between readings.
Selecting Failure Modes and Monitoring Format by Criticality
The most common program error is installing sensors across the asset base before deciding which failure each sensor should catch. Data volume grows fast. Planner-ready findings don't. The correct sequence starts with risk, moves to failure modes, and only then selects measurements and monitoring format.
NIST's manufacturing machinery maintenance guidance states that equipment or process failure characteristics should determine what data are collected, with critical failures indicating where prognostics and health monitoring should be integrated and measurable symptoms determining which sensors are appropriate. NIST identifies failure modes and effects analysis (FMEA), a structured review of how an asset can fail and what happens next, as the way to find observable parameters that predict each failure.
Step One Is Criticality Ranking
Criticality combines the consequence of failure with how often the asset fails. Consequence covers production loss, safety exposure, environmental impact, repair cost, and spare-parts lead time. A single non-spared compressor that stops a line ranks high even if it fails rarely. A small sump pump with an installed spare ranks low even if it fails yearly.
Ranking forces honest trade-offs. Continuous monitoring on every asset wastes capital and analyst time. Route-based checks on a high-consequence machine with a short P-F interval invite missed failures. The ranking, documented asset by asset, is what justifies each format choice later.
Planners can use risk priority numbers to score severity, occurrence, and detection consistently during FMEA. The score shouldn't become a paperwork exercise. Its job is to sort failure modes into monitor continuously, inspect on a route, maintain preventively, or run to failure.
Worked Example on a Chemical Process Pump
Take a chemical-process pump moving corrosive product. The FMEA team lists seal leakage, bearing wear, cavitation, impeller erosion, and motor faults. Each mode gets a measurement that reveals it and a threshold basis tied to a healthy baseline, not a generic catalogue number.
| Failure mode | Consequence | Measurement | Threshold basis |
|---|---|---|---|
| Seal leakage | Product loss and safety exposure | Visual inspection or leak sensor | Any confirmed leak triggers work order |
| Bearing wear | Shaft and housing damage | Accelerometers and temperature trend | Deviation from baseline at the same operating point |
| Cavitation | Impeller erosion and flow loss | Vibration, suction pressure and flow together | Spectral pattern plus operating context |
| Impeller erosion | Efficiency loss and imbalance | Vibration trend and performance data | Trend against the commissioning baseline |
| Motor faults | Trip and winding damage | Motor current or voltage signature | Change in current signature trend under steady load |
Notice how the measurements differ. Seal leakage doesn't need an accelerometer. Cavitation can't be confirmed from vibration alone because low suction pressure or off-design flow may be the root cause. Reading process variables alongside vibration separates mechanical degradation from an operating-condition problem, so crews fix the cause instead of replacing a healthy bearing.
Thresholds deserve the same care. A bearing temperature limit copied from another plant ignores load, speed, ambient conditions, and sensor placement. Deviation from a baseline captured at a known operating point is far more defensible. It also gives the analyst a trend rate, which supports an estimate of remaining time rather than a simple pass or fail.
Sorting Assets Into Monitoring Tiers
With failure modes mapped, assets fall into practical tiers:
- Continuous monitoring: Critical, non-spared rotating equipment with short P-F intervals or severe secondary damage. The third step in a mature program is continuous monitoring, with scheduled data collection and analysis that detects early-stage faults before they become failures.
- Route-based monitoring: Critical pumps, motors, gearboxes, and compressors with defined failure modes and P-F intervals long enough for monthly or quarterly readings using vibration, oil analysis, and MCSA.
- Preventive maintenance: Items with well-characterized wear curves, such as motor brushes and packing seals, or assets where condition monitoring isn't practical.
- Run to failure: Low-consequence assets with spares on site and no safety or environmental exposure.
Steam turbines show how intervals follow criticality in practice. Critical steam turbine units typically require monthly condition monitoring, while non-critical units may follow quarterly intervals, with work scheduled inside the mill's turnaround cycle. The same machine type gets different coverage because consequence and redundancy differ.
Frequency also has to respect the P-F interval. If a bearing fault can progress from first detectable symptom to functional failure in eight weeks, a quarterly route is decorative. Monthly readings give two chances to catch and confirm it. That's the arithmetic that should set routes, not the route technician's existing schedule.
Practical rule: This week, rank the asset list, name one measurement and one threshold basis for each critical failure mode, and assign every asset a tier.
That single exercise exposes most program gaps. Assets with sensors but no named failure mode, and critical failure modes with no measurement at all, both become visible immediately.
Why Predictive Programs Stall After Sensors Go In
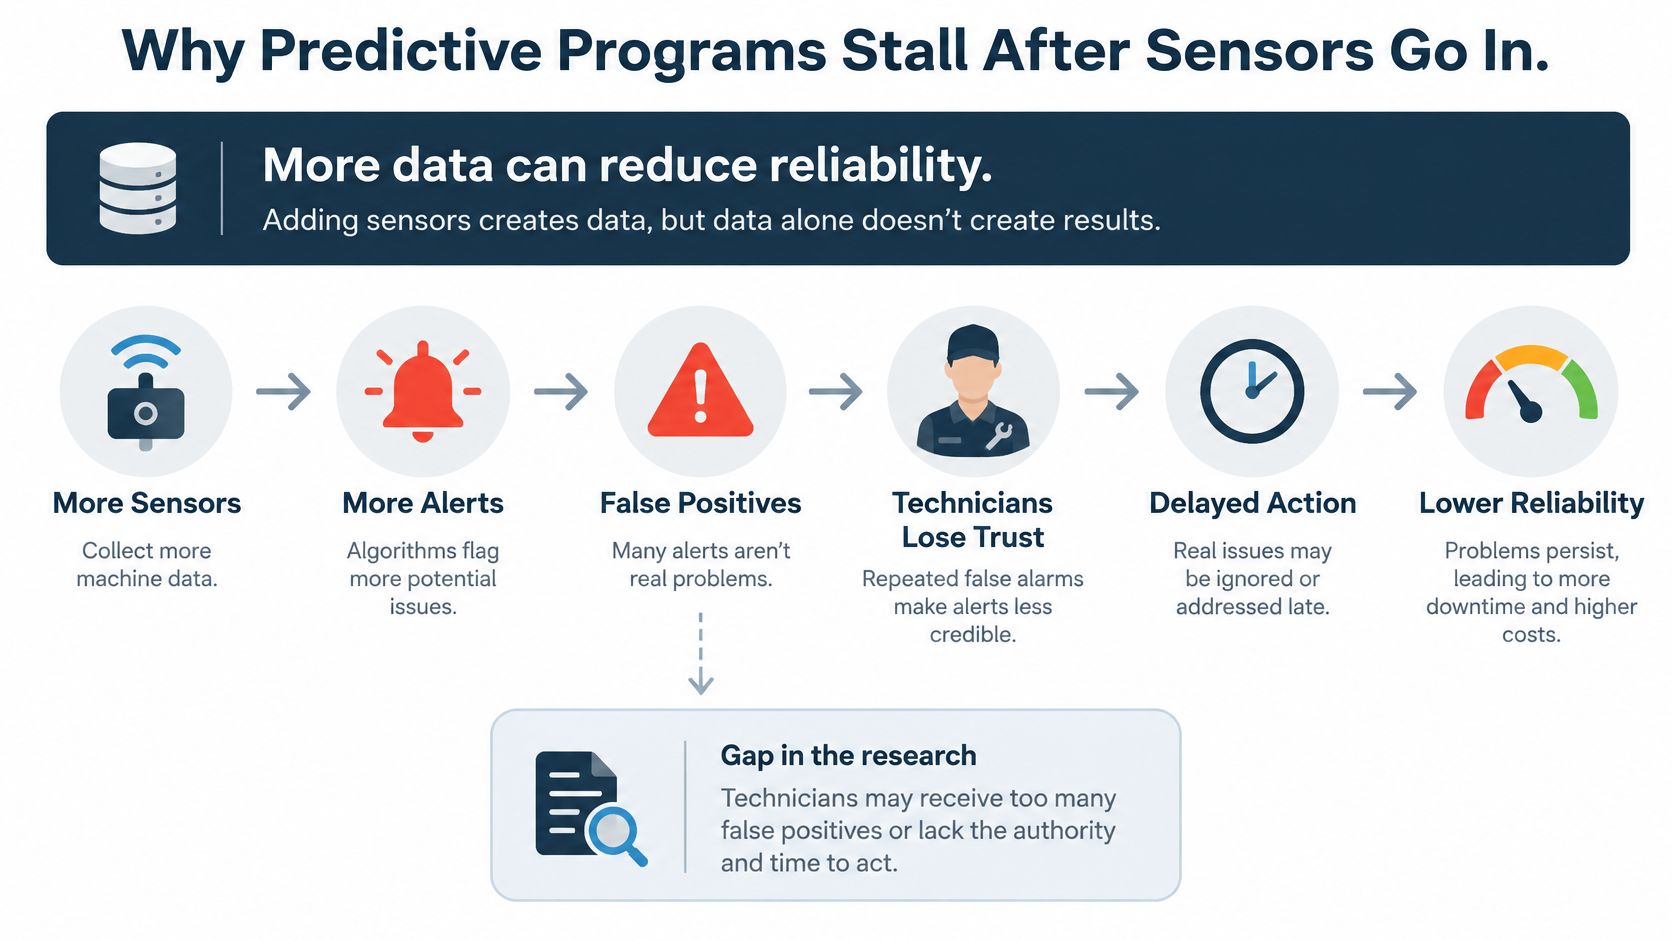
Predictive programs stall when alerts do not lead to clear decisions. Excessive false positives, unclear ownership, or insufficient time to respond can teach technicians to dismiss alarms. Workflow design determines whether sensor data prompts useful work or becomes background noise.
A 2025 survey of 1,320 maintenance professionals found that 27% of facilities actively used predictive maintenance, down from 30% the prior year. Nearly one-third used sensors or IIoT extensively, and another 41% were testing or considering them. Instrumentation can outpace workflow integration: uncalibrated sensors, inconsistent asset hierarchies, missing failure codes, weak alarm governance, and alerts that lack planner-ready job plans all leave findings stranded.
Run an Alert to Action Audit
- Define the failure mode: Name the specific fault the alert should detect. Without a defined mode, investigations may produce no maintenance decision.
- Set the detection interval: Match measurement frequency to the P-F interval. Reusing a legacy route interval without checking it against the failure mode can leave too much time between readings.
- Set a confidence threshold: Define how far a reading must deviate from baseline before work is raised. Thresholds that are too tight generate unnecessary alerts.
- Name the confirmation test: Specify whether an ultrasound check, oil sample, or second reading is needed before parts are ordered. Confirmation helps prevent noisy readings from triggering unnecessary purchases.
- Assign a decision owner: Give one person authority to schedule or defer the work. An alert sent to a distribution list can go unanswered.
- Record the consequence of deferral: State the operational risk of waiting. Without a clear consequence, deferral can seem cost-free until a fault progresses.
Each confirmed finding should enter the planning system with a job plan, parts list, and failure code. CMMS asset management supports that handoff. Forge Reliability assigns condition monitoring tasks with defined measurement points, alarm thresholds, frequencies tied to P-F intervals, and action requirements for exceeded thresholds.
For plants that already have sensors, audit how alerts move from detection to a work order before expanding instrumentation. The audit shows whether the program can turn a finding into a timely, documented maintenance decision.
KPIs That Prove Predictive Maintenance Is Paying Off
A drop in downtime does not prove that monitoring caused it. Production mix, asset replacement, and operating rates can all shift the results. Separate indicators of program execution from measures of equipment performance, then compare the same asset groups over matched periods.
Leading indicators show whether findings move through the maintenance process. Lagging indicators show what happened to equipment performance and cost. Track both, but use leading indicators to identify process gaps while there is still time to act.
| KPI | Type | What it shows | Watch for |
|---|---|---|---|
| Asset coverage | Leading | Share of critical assets with defined failure modes and alarms | Coverage without thresholds is not coverage |
| Alert precision | Leading | Share of alerts confirmed by inspection or test | Confirmed alerts should lead to a documented decision |
| Planned-work conversion | Leading | Share of findings turned into scheduled work orders | Findings that sit unscheduled give no benefit |
| Response time | Leading | Days from alert to decision | Delays allow secondary damage |
| Unplanned downtime | Lagging | Hours lost to unplanned stops by asset group | Changes in production load can distort the trend |
| Maintenance overtime and emergency spend | Lagging | Labor hours and expedited parts cost | Compare the same asset group over time |
| Overall equipment effectiveness (OEE) | Lagging | Availability, performance, and quality combined | Scheduling, materials, and operating changes can also move OEE |
Report reliability measures such as MTBF, MTTR, and OEE for monitored assets separately from the wider plant. OEE is useful for tracking performance, but it cannot isolate the effect of condition monitoring on its own.
The linked CMMS maintenance statistics summary reports average predictive maintenance effects of 25–30% lower maintenance cost, 70–75% fewer breakdowns, 35–45% less downtime, and an approximately 10:1 return on investment. Treat these figures as broad benchmarks, not forecasts for a specific plant. Forge Reliability predictive maintenance programs deliver a return of 3 to 5 times the investment.
Start monthly reviews with asset coverage, alert precision, and planned-work conversion. Together, they show whether the program is monitoring the right equipment, producing actionable findings, and converting those findings into scheduled work.
Launch Your Program and Book a Free Reliability Assessment
A monitoring program earns its place when a finding changes a maintenance decision. Start with a focused rollout, then expand only when the results justify the added coverage.
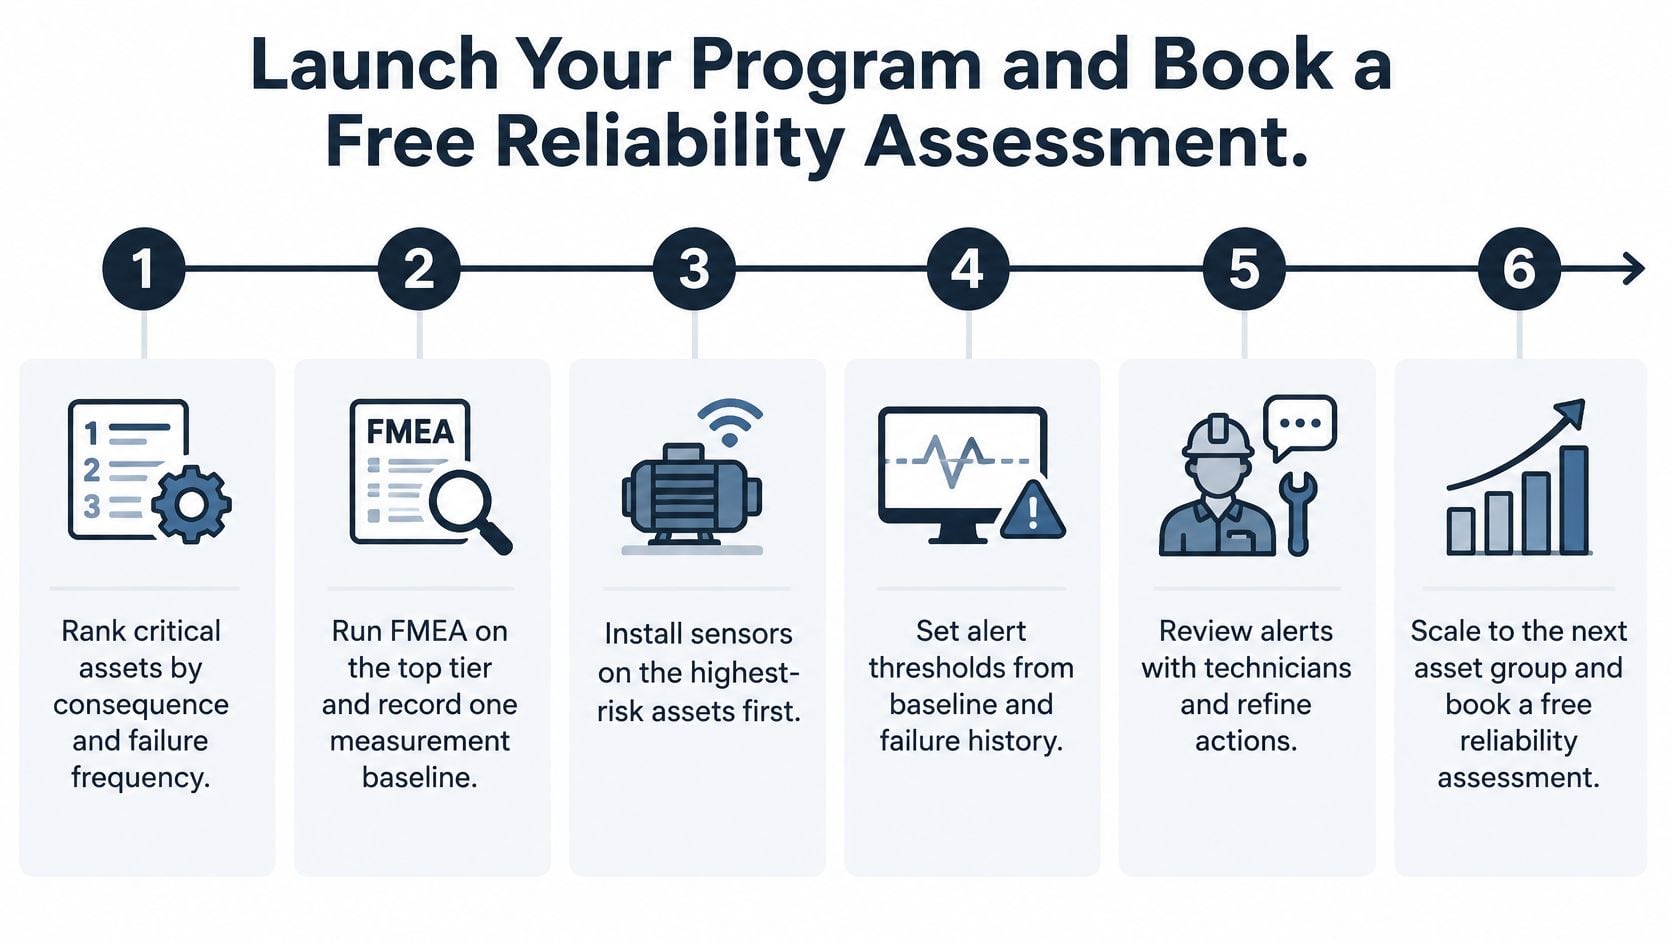
Six Steps to Launch
- Choose the first assets and failure modes using the priorities established earlier.
- Assign measurement tasks with clear owners and action requirements.
- Collect data in the operating conditions that make the readings useful.
- Route confirmed findings into planner-ready work orders.
- Review alert precision and planned-work conversion.
- Adjust the program when alerts fail to lead to useful action.
Scale Only Where Criticality Pays
Continuous monitoring adds value when a failure has serious consequences and route-based checks may not provide enough warning. A spared utility pump may remain on a route; a non-spared compressor whose bearing failure could damage a shaft and seal may justify continuous vibration and temperature trending.
For example, a food plant relying on one ammonia compressor for cold storage may monitor it continuously because a trip risks product loss. Redundant air compressors can remain on a monthly route.
Forge Reliability provides predictive maintenance, condition monitoring, and reliability consulting to help reduce unplanned downtime and extend equipment life. Its programs can use route-based or continuous monitoring, depending on the equipment and operating needs.
Request a free reliability assessment to identify where monitoring can support better maintenance decisions and which alerts should drive action. Contact Forge Reliability for an assessment focused on measurable uptime improvement.