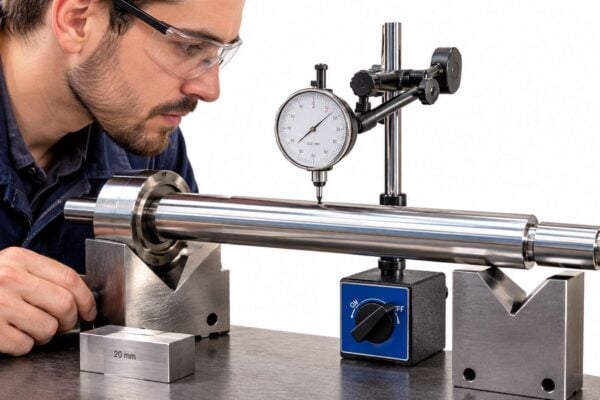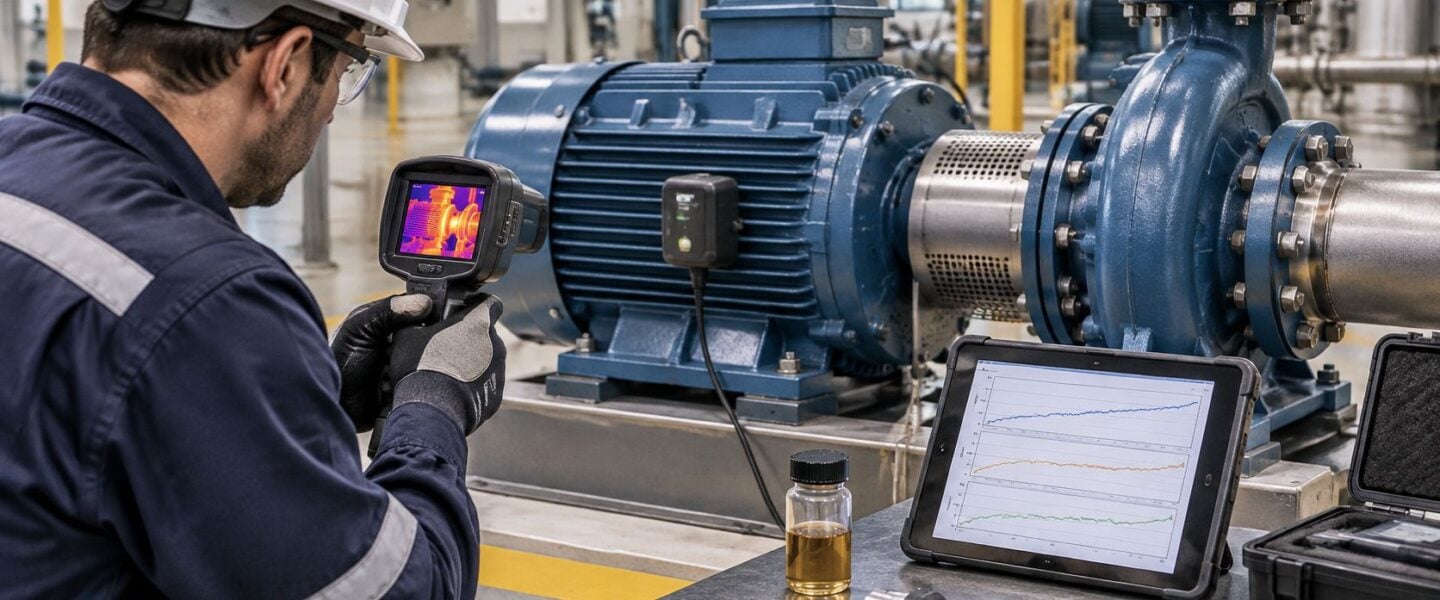
A pump bearing, a 6.6 kV motor winding, and a gearbox tooth fail on different clocks. A bearing can develop detectable vibration before the damage affects production. Partial discharge can degrade a motor winding before it grounds. A gearbox tooth may deteriorate through fatigue and then break during a production campaign.
Each predictive maintenance technique targets particular failure modes and supports a specific maintenance decision. The U.S. Department of Energy defines predictive maintenance as measuring degradation so its causes can be controlled before equipment reaches significant physical deterioration (DOE operations and maintenance guide).
The eight types below are compared by the faults they detect, their typical warning time, the data and instrumentation they require, and the decisions they support. For a starting point on matching techniques to plant needs, see these predictive maintenance use cases.
Table of Contents
- 1. Vibration Analysis
- 2. Oil Analysis (Lubricant Condition Monitoring)
- 3. Infrared Thermography
- 4. Ultrasonic Testing for Condition Monitoring
- 5. Motor Current Signature Analysis (MCSA)
- 6. Performance and Process Parameter Monitoring
- 7. Electrical Insulation Testing and Partial Discharge Analysis
- 8. Wear Debris Analysis and Ferrography
- How the eight predictive maintenance types compare by standards, best-fit assets, and main limitation
- Matching Predictive Maintenance Types to Your Critical Assets
1. Vibration Analysis
Vibration analysis is the most widely used technique on rotating equipment for a simple reason: almost every mechanical fault changes the way a machine moves. Accelerometers and velocity sensors measure oscillation of bearings, housings, and shafts, and a Fast Fourier Transform (FFT) separates the raw time-domain signal into its individual frequency components.
Each fault writes its own signature. Imbalance produces a dominant running-speed (1x) peak. Misalignment lifts axial vibration and the 2x harmonic. Rolling-element bearing defects show as defect-frequency energy, often buried until envelope demodulation pulls them out. Gear mesh problems appear at the tooth-mesh frequency and its sidebands.
Overall vibration is usually judged against ISO 10816 and ISO 20816, the international standards for evaluating machine vibration. Limits belong on each machine, not copied from a chart. The DOE nuclear facility maintenance guidance recommends establishing nominal limits for every monitored machine, comparing similar designs, and using historical data from machines of the same type with good operating histories.
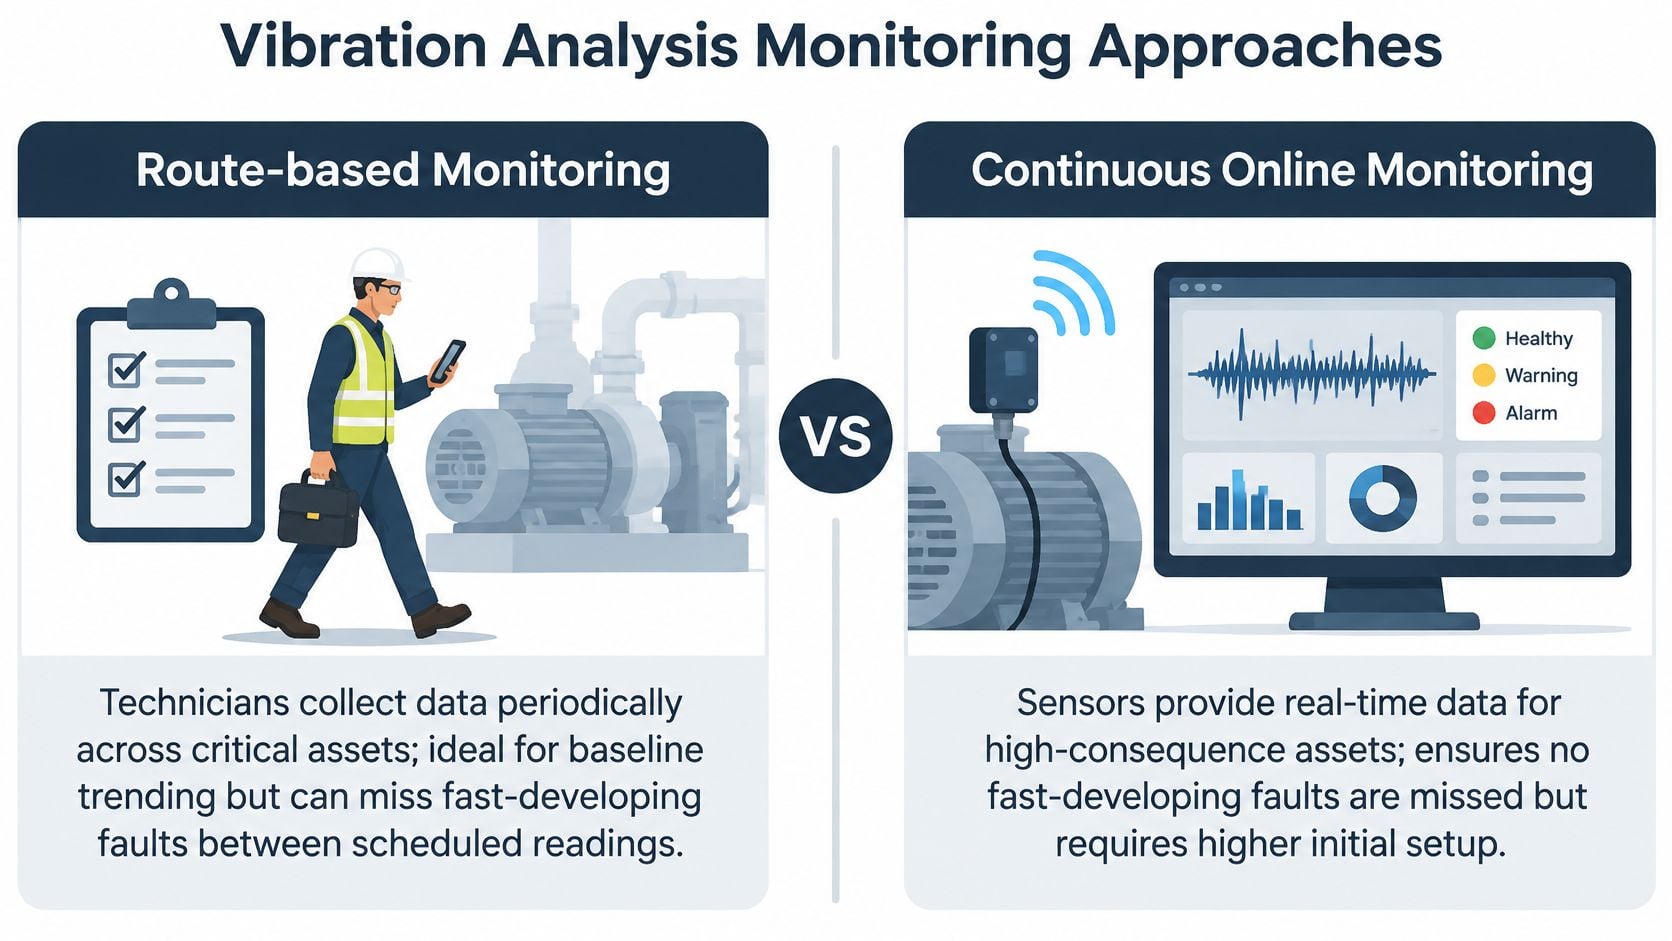
Lead time to expect: a developing bearing defect typically gives weeks to months of warning on a route-based program, which is enough to fold the repair into a planned outage instead of an emergency call-out.
A 600 kW boiler feed pump in a power station shows the decision logic. A rising 1x peak paired with increased 2x harmonics points to coupling misalignment rather than a failing bearing, and realigning the coupling before the bearing loads up avoids both an unplanned trip and a multi-day outage. On a paper mill's high-speed fan, envelope analysis found an outer race bearing defect that a raw spectrum had hidden, and the bearing was replaced during a scheduled shutdown. Start with a route-based baseline on every critical pump, compressor, and motor, then move high-consequence assets to continuous online monitoring as the economics justify it.
Making a route produce decisions
- Baseline under repeatable conditions. Record speed, load, and process state on every route so trends mean something.
- Use envelope demodulation for bearings. High-frequency detection finds defects long before they appear in overall levels.
- Mount rigidly. Stud-mount accelerometers where possible, because magnetic and handheld readings are less repeatable.
- Trend fault frequencies, not just overall values. A single alarm threshold hides the slope that predicts failure.
- Pair with process data. A load change can mimic a fault, and a fault can hide behind a load change.
If the plant has no analyst, this guide to how to measure vibrations covers the collection method before the interpretation step.
2. Oil Analysis (Lubricant Condition Monitoring)
Oil analysis answers two questions from one sample: is the lubricant still fit for service, and is the machine wearing out? Tests cover viscosity, water content by Karl Fischer titration, total acid number (TAN), total base number (TBN), particle counting, and spectrometric elemental analysis for wear metals such as iron, copper, lead, and tin, plus contaminants such as silicon and sodium.
Cleanliness is reported with ISO 4406 particle count codes, which give a standard way to compare contamination between systems. That matters because many hydraulic and lubrication failures trace back to contamination rather than metal-on-metal wear.
The DOE's lubricating-oil analysis guidance splits the decision three ways: lubricant condition, lubrication-system integrity, and machine condition. It also states that all machines with motors of 7.5 horsepower or larger, along with critical or high-cost machines, should be evaluated for routine oil analysis at monthly-to-quarterly intervals, and identifies quarterly analysis as appropriate for fixed hydraulic systems.
Take an oil and gas compressor station where silicon and aluminum climb while the ISO 4406 code slips several levels. That combination points at a failing air intake filter, not at bearing wear, and replacing the filter plus flushing the system prevents the bearing damage that would have followed. In a food plant, rising water content and TAN in a gearbox oil circuit exposed a leaking heat exchanger before the gears were touched.
Sampling rules that keep the trend honest
- Sample at the right point. Pressurized return line or a dedicated sample valve, never the drain, and always the same point.
- Sample hot and circulating. At operating temperature, but never immediately after an oil change.
- Set limits per machine and per oil type. Baseline values vary too much for generic limits.
- Trend, don't react. One sample is a data point; three samples are a trend.
- Read the filter. Debris on filters and magnetic plugs confirms what the lab reports.
Procedure decides whether any of it holds up, and this walkthrough of oil sampling and analysis covers the routing detail.
3. Infrared Thermography
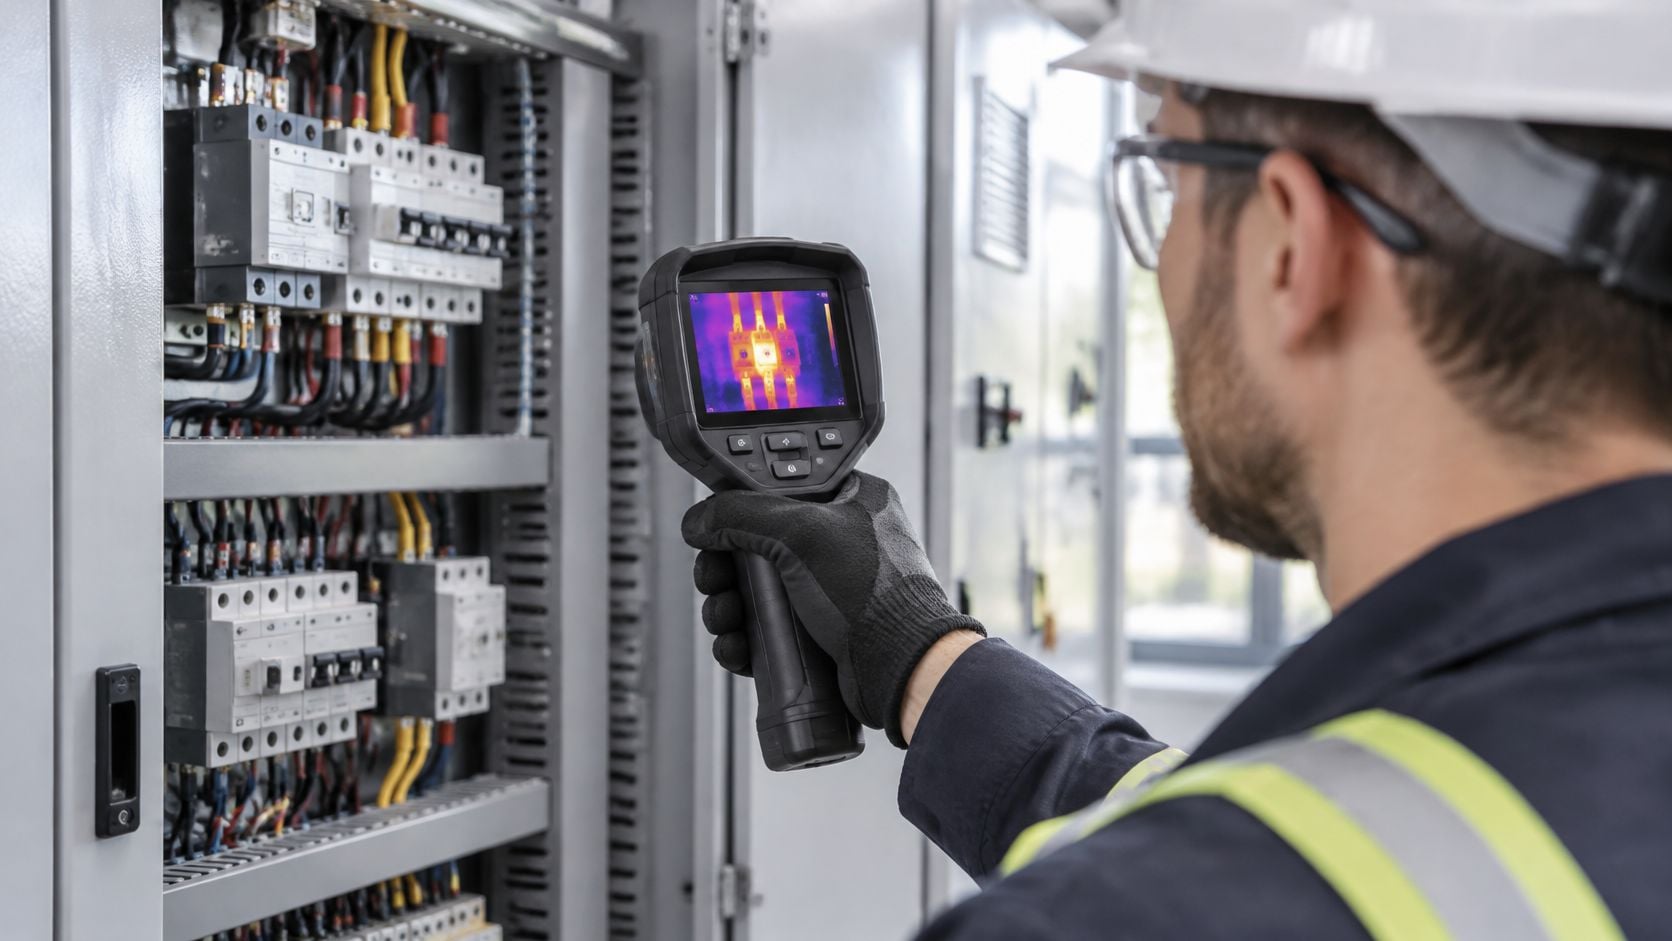
Heat is the earliest visible symptom of many failures: high-resistance electrical connections, unbalanced loads, failing bearings, insulation breakdown, refractory damage, failed steam traps. An infrared camera turns that heat into an image, and the comparison that matters is between the hot component and a reference component under similar load, not the absolute temperature on the display.
The method's advantage is access without shutdown. Thermography is non-contact, so energized switchgear, motor control centers, and process piping can be surveyed while the plant runs. Accuracy depends on controlling emissivity, reflected temperature, distance, and load, and ISO 18434-1 defines the procedures for thermographic condition monitoring.
DOE pumping-system guidance identifies infrared scanning as an early-warning method for hot spots and notes that oil analysis complements it by identifying overheating, metal particles, seal leakage, and bearing-life concerns (DOE pump system improvement sourcebook).
A cement plant survey of a 6.6 kV motor control center found one bus connection running about 40 degrees C above adjacent phases. Re-torquing that connection during the next planned shutdown removes an arc flash risk and the kiln stoppage that would have come with it. A pulp and paper mill used the same kind of survey to find failed steam traps, which recovered steam energy across the site.
A thermal image is a screening and localization tool, not a diagnosis. Confirm every anomaly with a second technology before deciding to run, derate, repair, or shut down.
- Load the circuit. Survey electrical equipment at 40 percent of rated load or more so temperature differences are measurable.
- Record the conditions. Ambient temperature, load, emissivity setting, and distance belong with every image.
- Compare like with like. Similar components under similar load, never absolute temperatures alone.
- Respect the boundary. Follow arc flash boundary requirements and wear the PPE the panel demands.
- Close the loop in the CMMS. Every hot spot needs a documented disposition.
Thermography inspections go deeper into survey planning and reporting.
4. Ultrasonic Testing for Condition Monitoring
Ultrasound listens above human hearing, typically in the 20 kHz to 100 kHz band, where friction, turbulence, electrical arcing, and leaking gas or fluid all show up. Handheld detectors isolate those signals from plant noise and trend them in decibels against a reference level.
The niche where ultrasound beats everything else is early lubrication distress. A bearing that has started to run dry climbs in ultrasonic level well before temperature rises or a vibration spectrum changes. The same instrument finds compressed air and steam leaks, corona and tracking on switchgear, and leaking valves.
The technique suits route-based work, and the data requirement is modest. A review of maintenance types and their data requirements notes that route-based methods can supply condition evidence without continuous connectivity, while continuous sensors suit highly critical rotating equipment, fast-developing failure modes, or assets whose failure consequences justify the instrumentation cost. Ultrasound fits the first category almost perfectly: one technician, one instrument, a fixed route.
A food and beverage plant shows the value. Ultrasonic readings on conveyor drive bearings climbed sharply while temperature and vibration stayed inside normal limits, and relubrication with the correct grease quantity at that point prevents a bearing seizure and a line stop mid-run. A chemical plant used the same technique for a compressed air leak survey and found losses representing a meaningful share of the site's air demand.
Getting repeatable ultrasonic data
- Fix the setup. Same probe, same gain, same contact technique on every visit, or the trend is noise.
- Grease by the reading. Use ultrasonic level to set grease quantity and stop before over-greasing adds heat.
- Confirm leaks from several angles. Directional probes pick up reflections that look like a second leak.
- Cross-check bearings with vibration. Ultrasound flags friction early; vibration characterizes the defect.
- Document conditions. High background noise can mask or mimic a signal, so record what else was running.

5. Motor Current Signature Analysis (MCSA)
An electric motor's current carries information about everything it drives. Motor current signature analysis reads the current spectrum and looks for sidebands and patterns created by broken rotor bars, eccentricity, bearing defects, and load problems. Broken rotor bars produce sidebands around the line frequency; air-gap eccentricity and bearing faults leave their own families of peaks.
The practical appeal is access. Current can usually be measured at the motor control center without opening the motor or reaching a hazardous location. Because the load shapes the current signature, MCSA also picks up driven-equipment problems such as pump cavitation, belt issues, and valve or process restrictions.
Threshold discipline is where most programs fail. A peer-reviewed study of condition-based and preventive maintenance policy makes the point that alarm thresholds should not be copied from generic tables, since vibration velocity, acceleration-envelope energy, oil-particle counts, winding-current sidebands, and thermal gradients all need normalizing for speed, load, process state, sensor location, and baseline variability. A load change can shift a current sideband as easily as a rotor fault can.
At a water and wastewater treatment plant, MCSA on a 250 kW raw sewage pump motor identified sidebands associated with a broken rotor bar, and scheduling the repair during a low-demand period prevents a loss of pumping capacity during peak inflow. At a metals plant, a current sideband pattern on a fan motor traced to a belt-driven load problem that was corrected before bearing damage developed.
- Hold load steady. Record load, speed, and voltage with each reading.
- Confirm nameplate data. Pole count and rated slip are needed before fault frequencies can be calculated.
- Keep the measurement point fixed. Same probe, same location, every time.
- Handle VFDs carefully. Drive harmonics can mask fault signatures, so sampling and analysis have to suit the drive.
- Confirm before acting. Vibration or thermography should support a major repair decision.
The broader picture of electrical fault detection covers insulation, current, and thermal testing together, and how to read current signature spectra explains the frequency math behind the sidebands.
6. Performance and Process Parameter Monitoring
Not every failure announces itself as a vibration peak. Some show up only as lost efficiency. Performance monitoring compares measured pressure, flow, temperature, power, speed, and differential pressure against design data or an established baseline, and the deviation is the symptom.
A centrifugal pump with worn impellers loses head and efficiency long before it fails mechanically. A compressor with fouled intercoolers shows rising discharge temperature and higher power draw. Performance monitoring pays for itself on gas turbines, steam turbines, heat exchangers, and fans, where degradation converts directly into fuel cost and lost output. Formal procedures exist for acceptance work, including ASME PTC 22 for gas turbines and ASME PTC 10 for compressors.
The trap is instrumentation drift. A drifting transmitter produces a beautiful trend that means nothing, which is why calibration status has to be part of the review. A NIST manufacturing study lists false alarms, missed detections, inadequate automated analytics, and barriers to integrating and fusing data from different systems among the practical problems in predictive programs (NIST advanced manufacturing study). Process parameter monitoring is especially exposed to that failure mode, because the actual signal is small and the noise includes the weather.
In a combined-cycle plant, tracking corrected output and heat rate can reveal fouling of the gas turbine compressor blades, and an online water wash scheduled during normal operation recovers most of the lost output without a full outage. A chemical plant that trends heat exchanger approach temperature and pressure drop can schedule cleaning instead of waiting for a throughput limit to force the issue.
- Correct for ambient conditions. Temperature, pressure, and load corrections separate real degradation from weather.
- Verify calibration first. Drifting instruments are the most common cause of false performance alarms.
- Trend daily, not quarterly. Formal performance tests are too infrequent to catch a fouling trend early.
- Record the action. Link each deviation to the maintenance work performed, so the next decision has history.
- Use the test codes where formality matters. ASME PTC procedures exist for contractual acceptance testing.
7. Electrical Insulation Testing and Partial Discharge Analysis
Insulation fails slowly and then all at once. Insulation resistance (IR) testing, polarization index (PI), dielectric absorption, and winding resistance measurement show how far the slow phase has gone in motors, generators, transformers, and switchgear. Partial discharge (PD) analysis goes a level deeper by detecting the small localized discharges inside voids, cracks, and surface contamination that erode insulation from within.
Amplitude and pattern indicate how advanced the degradation is. The highest-stakes applications are high-voltage motors, generators, and cable systems, where a failure damages expensive iron and takes weeks to recover from. IEEE 43 is the recommended practice for insulation resistance testing of rotating machinery, and IEEE 1434 covers partial discharge measurement.
At a steel plant, periodic testing of a 6.6 kV mill drive motor showed a falling polarization index and rising partial discharge activity. Scheduling the rewind during a planned shutdown avoids a stator ground fault that would have damaged the core and cost weeks of production. A water utility used routine IR testing on pump motors to catch moisture ingress in time to dry the winding and repair the insulation.
Test rule: a single passing IR reading proves very little. The trend across intervals, corrected for winding temperature, is what predicts failure.
Reading insulation results correctly
- Temperature-correct every reading. Record winding temperature with each test, or the trend is meaningless.
- Read PI for moisture. A falling polarization index usually means moisture rather than general aging.
- Baseline PD while healthy. Absolute PD levels vary between machines, so each one needs its own reference.
- Follow high-voltage safety rules. Lockout-tagout and HV procedures govern the test, and results never substitute for safe energization practice.
- Correlate with operating history. Overheating, contamination, and repeated starts all belong in the interpretation.
Motor insulation resistance testing covers the test sequence and how to interpret thresholds.

8. Wear Debris Analysis and Ferrography
Spectrometry reports how many parts per million of iron sit in the oil. Ferrography reports what shape the particles are. That difference decides the diagnosis.
Wear debris analysis examines particles themselves: size, shape, composition, and surface texture. Analytical ferrography passes the sample across a magnetic field so ferrous particles deposit on a glass slide, then puts the slide under a microscope. Morphology maps to mechanism. Sliding wear produces long thin particles. Rolling contact fatigue produces laminar flakes. Severe sliding or scuffing produces large irregular particles. Cutting wear produces spiral or curled chips.
That mapping is the whole value. A gearbox shedding laminar flakes has a fatigue problem, and the answer is a gear inspection. A gearbox shedding cutting chips has an abrasive contaminant problem, and the answer is filtration and cleanliness control. On an elemental report the two look identical.
Particle counts also need normalizing to the asset. An analysis of condition-based maintenance economics stresses that the optimal policy depends on downtime cost, corrective-maintenance cost, degradation rate, planned outage windows, and the option of grouping work across assets, and reports that maintenance costs can represent up to 70% of product value in some contexts. A particle count that matters on a 4,000 kW mill drive means almost nothing on a small lube skid.
In a mining operation, analytical ferrography on a conveyor drive gearbox showed a rise in large laminar particles, which points to rolling contact fatigue on a gear tooth, and pulling the gearbox early avoids the catastrophic failure that would stop ore production. At a cement plant, ferrography on a kiln drive gearbox separated abrasive contamination from genuine gear wear and sent the team to improve filtration instead of ordering gears.
- Sample the same place every time. Location and operating condition have to match or the trend is invalid.
- Run all three tests. Ferrography, spectrometry, and particle counting each reveal something the others miss.
- Chase laminar and spherical particles fast. Both indicate advanced fatigue.
- Check filters and magnetic plugs. Physical evidence confirms the laboratory's read.
- Agree the trending plan with the lab. A change in morphology across samples is the signal.
How the eight predictive maintenance types compare by standards, best-fit assets, and main limitation
| Method | Governing Standards | Best-Fit Assets | Main Limitation |
|---|---|---|---|
| Vibration Analysis | ISO 10816, ISO 20816, ISO 18436-2 | Pumps, compressors, motors, bearings, gearboxes | Requires skilled analysis; standard sensors are less effective on low-speed equipment |
| Oil Analysis (Lubricant Condition Monitoring) | ISO 4406, ASTM D7720 and related ASTM methods | Gearboxes, hydraulic systems, engines, turbines, compressors | Results depend on representative sampling and consistent trending |
| Infrared Thermography | ISO 18434-1, NFPA 70E | Switchgear, motor control centers, electrical connections, process piping | Detects surface heat only; readings are affected by load, emissivity, and reflections |
| Ultrasonic Testing for Condition Monitoring | ASTM and ISO guidance on ultrasonic examination and reporting | Bearings, low-speed machinery, compressed-air and steam systems, switchgear | Probe technique and background noise can affect readings |
| Motor Current Signature Analysis (MCSA) | IEEE 1415, IEEE 112 | Motors and driven equipment, including inaccessible or hazardous installations | VFD harmonics and light loads can obscure fault signatures |
| Performance and Process Parameter Monitoring | ASME PTC 10, ASME PTC 22, ANSI/HI pump test standards | Pumps, compressors, turbines, heat exchangers, boilers, fans | Requires reliable baselines and instrumentation; does not pinpoint the failing component |
| Electrical Insulation Testing and Partial Discharge Analysis | IEEE 43, IEEE 1434 | High-voltage motors, generators, cables, switchgear | Offline tests require shutdown; partial discharge interpretation needs specialized expertise |
| Wear Debris Analysis and Ferrography | ISO 4406, ASTM wear debris and ferrography methods | Gearboxes, bearings, hydraulic systems | Slower and more costly than basic oil analysis; requires specialist interpretation |
Matching Predictive Maintenance Types to Your Critical Assets
A pump with rising bearing vibration and contaminated oil needs a different response from a motor with an electrical fault. Choose the technique after ranking asset criticality and reviewing likely failure modes. Starting with sensors can produce more data without clearer maintenance decisions.
For rotating equipment, vibration analysis and oil analysis provide complementary evidence: vibration can reveal mechanical changes, while oil analysis can identify lubricant condition and wear. Electrical assets may need thermography to find abnormal surface heating and insulation testing or partial discharge analysis to assess winding or insulation faults. For motors in hazardous or inaccessible locations, MCSA can assess electrical fault signatures from motor current data.
Monitoring effort should reflect asset criticality and the quality of available information. A NIST survey of manufacturing maintenance practice reported average maintenance activity of 45.7% reactive, 31.8% preventive, and 17.3% predictive across surveyed establishments. It also estimated annual national losses from inadequate maintenance at about $222.0 billion. The survey found lower unplanned downtime and fewer defects among predictive-focused organizations than among those relying more on preventive maintenance alone. Those results depend on usable failure histories, credible alarm thresholds, competent diagnosis, available spare parts, and work orders that close the loop.
Data maturity limits which techniques will work. Research on matching predictive methods to available data identifies data quality, relevance, and availability as key barriers and recommends scaling programs to the engineering knowledge and records a plant has. With few failure records and changing loads, route-based checks using ultrasound may support better decisions than a supervised model.
Measure the program by decisions, not dashboards. Track completed work orders, avoided failures, alert precision, and schedule compliance to judge whether monitoring supports maintenance action.
Predictive maintenance catches roughly 80% of mechanical failures with 200 to 1,500 hours of lead time, depending on the failure mode. Programs deliver a return of 3 to 5 times the investment. Forge Reliability builds customized programs using criticality ranking and failure-mode review, with route-based or continuous monitoring, and starts engagements with a no-cost reliability assessment.
Request a free reliability assessment from Forge Reliability to identify where condition monitoring can help reduce unplanned downtime. Engagements include a 24-hour response from plant-floor specialists.