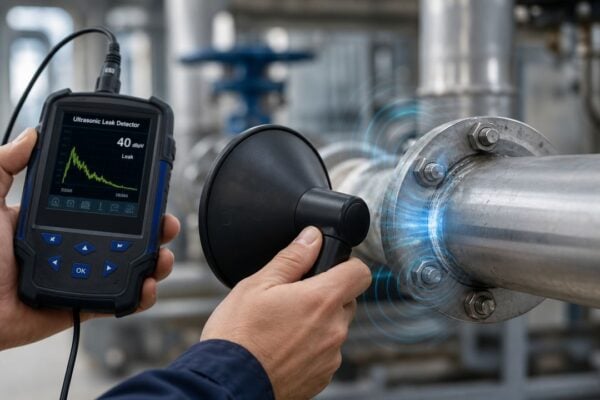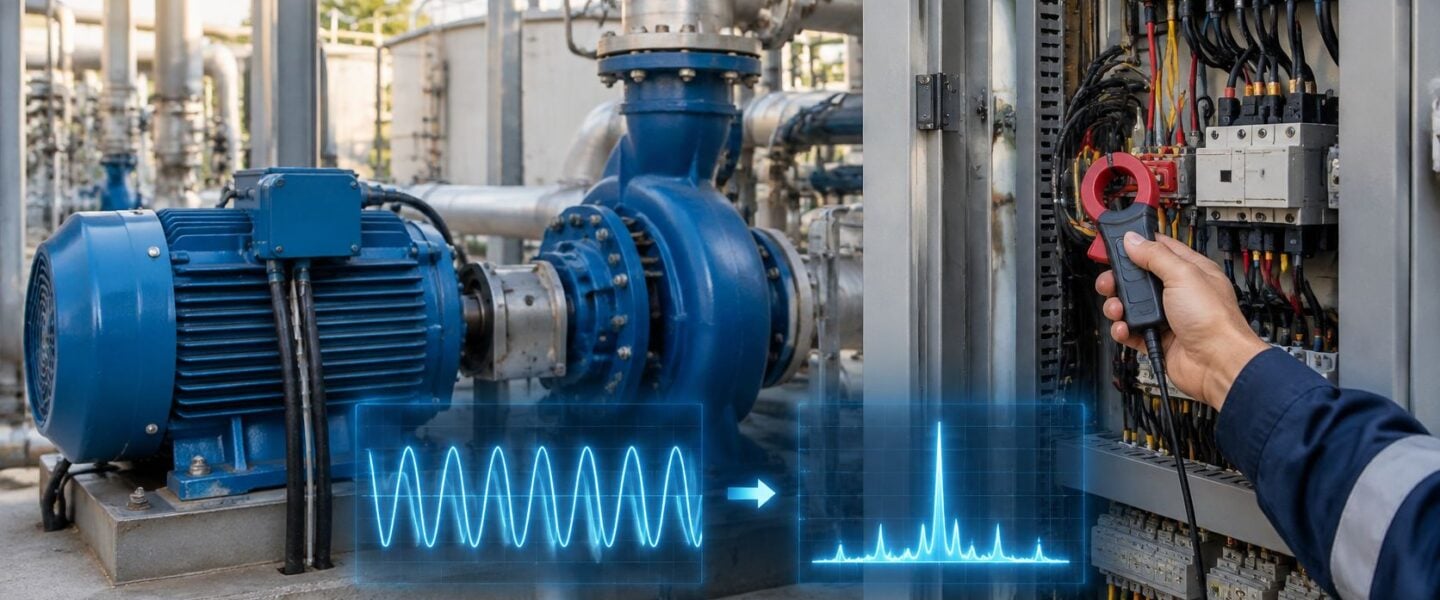
The sideband alarm on the cooling water pump motor came in overnight, and the spectrum looks exactly like a cracked rotor bar. The plant is still making rate, the pump flow hasn't moved, and nobody has time for a false trip of the cooling circuit. That is the daily problem with electrical signature analysis: the current waveform can show a real defect, or it can show a load change, a drive setting, or a dirty supply that only looks like one.
A trustworthy reading starts with the operating state, not the peak. Speed, slip, load, and voltage quality decide whether the pattern is damage or a normal day on the process.
Table of Contents
- How Electrical Signature Analysis Reads a Motor
- Fault Signatures Hidden in Motor Current
- When Operating Conditions Mimic a Fault
- A 200 kW Cooling Water Pump Motor Case
- Choosing a Threshold Strategy for Multi-Site Fleets
- How to Build a Signature Monitoring Program
- Confirm Your Motor Risk Before the Next Outage
How Electrical Signature Analysis Reads a Motor
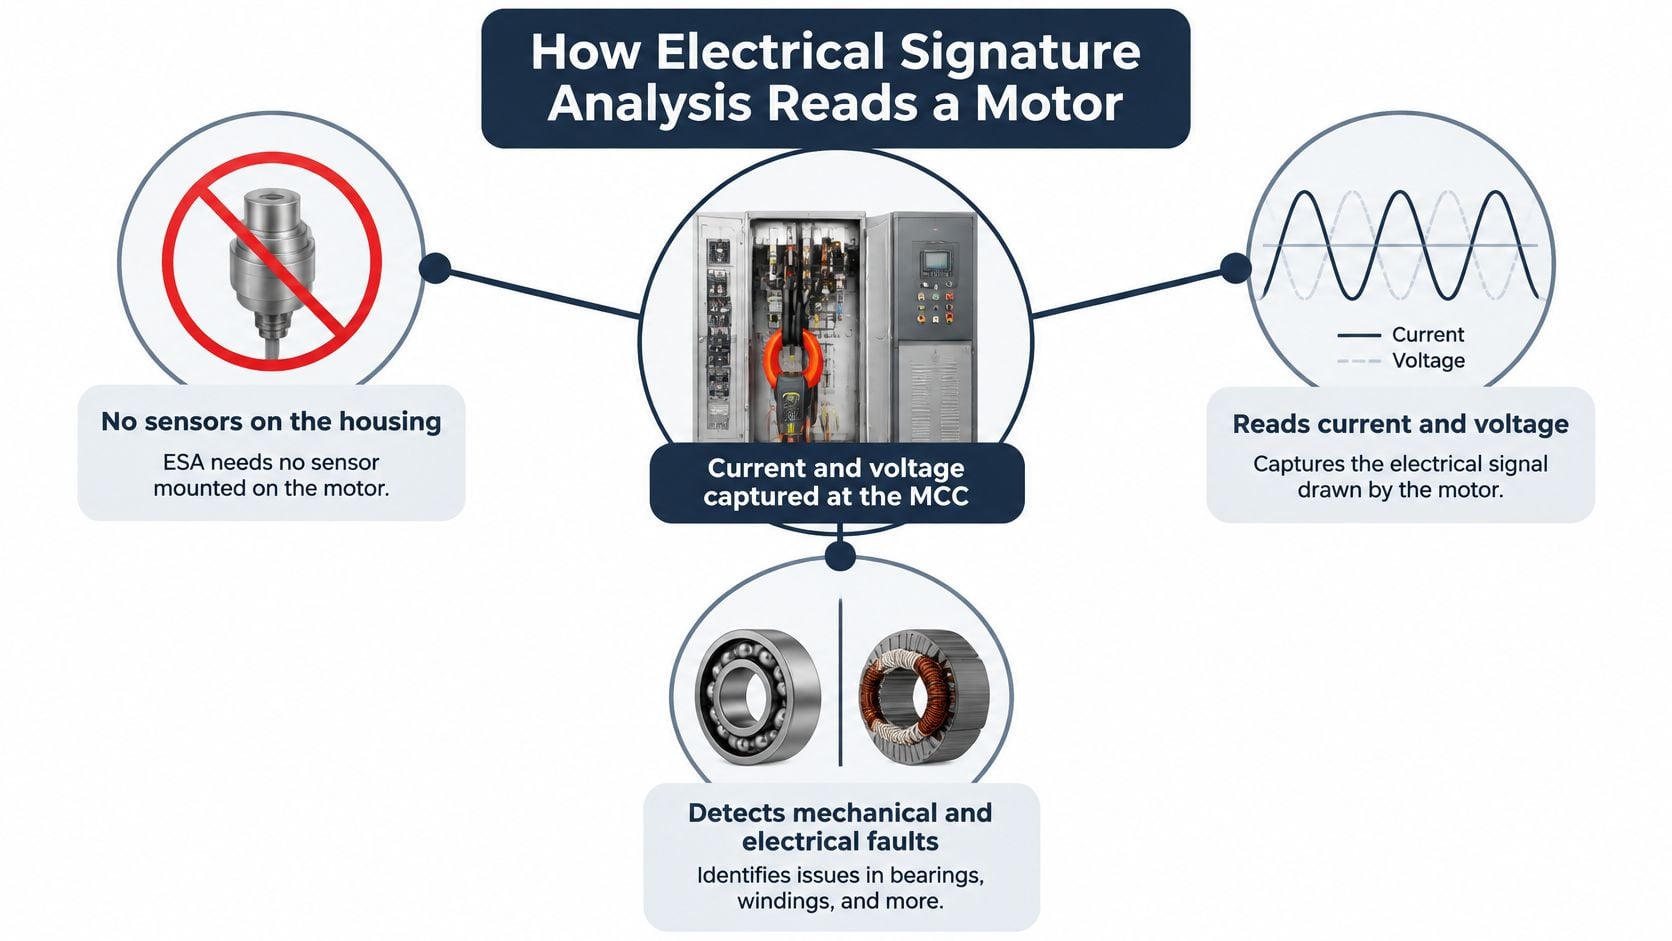
Think of the supply cables the way a pipe carries the knock of a failing pump. The motor's current and voltage already carry fingerprints of the rotor, the stator, and the load. Electrical signature analysis (ESA) reads those fingerprints at the motor control center, so the technician doesn't have to mount accelerometers on the housing. Motor current signature analysis (MCSA) is the most common form, and it looks only at current.
The method has a long paper trail. A Springer chapter on motor monitoring traces it through Tavner, Gaydon, and Ward's 1986 paper "Monitoring generators and large motors," Kliman and Stein's 1992 paper "Methods of motor current signature analysis," and Benbouzid's 2000 IEEE review, which treats induction-motor signature analysis as a way to detect and locate abnormal electrical and mechanical conditions.
Three steps from clamp to spectrum
- Capture the current. A clamp on the supply leads at the panel records the waveform while the motor runs. Voltage on the same feeder is worth logging at the same time, because supply quality changes the picture.
- Transform the waveform. A Fast Fourier Transform turns that time trace into a frequency spectrum. The tall peak is the line frequency, often 60 Hz in North American plants.
- Read the neighbors of that peak. Harmonics sit at multiples of line frequency. Sidebands sit a small distance to either side. Rotor, stator, air-gap, and load problems each nudge those neighbors in a recognizable way.
The same chapter is blunt about context. Load torque variation and rotor-bar faults can generate overlapping spectral components, so speed, slip, load, and drive type belong on every spectrum sheet. Slip is the gap between synchronous speed and actual speed, and it sets where rotor-bar sidebands should land.
Plants use this path for motors that are hard or hazardous to reach, and for route-based or remote coverage across dozens of assets. On a three-phase cooling water pump, the same current that tells you the motor is loaded also carries the fault pattern. If the site also runs smaller single-phase loads in shops and support buildings, a clear note on kW capacity for homes and shops keeps those circuits from being diagnosed with industrial three-phase rules. When the spectrum points at the winding rather than the rotor, the next check is an insulation resistance test at the next safe window, not another current capture.
Fault Signatures Hidden in Motor Current
A healthy spectrum is a tall line-frequency peak with small, stable sidebands. Fault energy shows up as extra sidebands spaced away from that peak, or as a growing imbalance between phases. One noisy capture doesn't make a case. The spacing, the load at the time, and the trend do.
For a broken or cracked rotor bar, the classic spacing is fs ± 2sf. Here fs is line frequency and sf is slip frequency, the slip fraction times line frequency. Those sidebands grow as torque rises, so a light-load reading can hide a bar that is already cracked. Take the reading at a defined load, and write that load on the sheet.
An IEEE paper on motor fault diagnosis reports a frequently cited split: about 53% of industrial-motor failures are mechanical and 47% are electrical. Bearings account for about 41% of total failures, unbalance and misalignment for 12%, winding failures for about 37%, and rotor failures for about 10%. Those shares are why current analysis isn't only an electrical test. Eccentricity and bearing defects modulate air-gap flux, torque, and stator current, so the spectrum can flag mechanical wear on pumps, fans, compressors, conveyors, and process drives where a vibration sensor is awkward to mount.
Four faults and the decision each one supports
| Fault | Current signature | Confirm with | Decision trigger |
|---|---|---|---|
| Broken or cracked rotor bar | Sidebands at fs plus or minus 2sf around the line-frequency peak, growing with load | Vibration spectrum at running speed and a rotor test at the next outage | Sidebands rising across three readings at equal load |
| Stator winding degradation | Phase current imbalance and stator-related components in the spectrum | Insulation resistance and polarization index test; thermography of the winding | Imbalance trend that persists after supply voltage is checked |
| Bearing defect | Modulation sidebands at bearing defect frequencies around the line-frequency peak | Vibration envelope analysis and bearing temperature trend | Bearing sidebands rising while vibration confirms the defect |
| Air-gap eccentricity | Sidebands spaced at rotational frequency from the line-frequency peak | Vibration at running speed, shaft alignment check and air-gap measurement during outage | Eccentricity pattern confirmed by a second technology |
The trend rule that turns a reading into work
Screen with current, then confirm severity with vibration, thermography, process data, or an offline electrical test before anyone schedules a repair. Variable-speed drives, a swinging load, supply imbalance, and a start transient can paint the same lines as a fault, so those conditions get ruled out first.
Practical rule: One high sideband means little. The same sideband rising across three consecutive readings at equal load is the trigger to book the confirmation test.
On a chemical-plant cooling water pump, that rule keeps a single noisy route from pulling the motor early, and it also stops a real bar crack from waiting until the next unplanned trip.
When Operating Conditions Mimic a Fault
A current signature is not proof of damage. Non-invasive measurement is not context-independent measurement. A false positive is a normal operating change that paints a fault-like sideband. A false negative is a real defect buried under noise, unbalance, or a moving operating point, so the alarm never comes.
A 2026 Scientific Reports study found that current features change with ordinary load variation, which makes maximum current misleading unless the data is normalized for operating state. Its best-performing model improved reported accuracy from 96.1% to 99.0% after load-aware normalization. The same body of work flags low signal-to-noise ratio, voltage unbalance, harmonic pollution, and time-varying operating points as conditions that smear or mask narrowband fault components.
Conditions that copy a defect
| Condition | Effect on current spectrum | Check or normalization |
|---|---|---|
| Load swing on pumps or fans | Raises current amplitude and sideband levels with no defect present | Compare only against a baseline taken at matching load, using process flow or kW |
| VFD speed change and carrier harmonics | Shifts the slip assumptions and smears narrowband components | Use a baseline per speed band and log VFD frequency with each reading |
| Supply voltage unbalance | Adds negative-sequence current that resembles a winding fault | Measure voltage unbalance at the motor control center and correct the supply before diagnosis |
| Low signal-to-noise measurement | Masks narrowband fault components, causing false negatives | Lengthen the measurement window and verify current transformer and sensor quality |
| Start and stop transients | Produces broadband spikes that look like damage | Analyze steady-state windows only |
Build the baseline by load, speed, voltage quality, drive frequency, and process state before any alarm limit is set. Match each spectrum to PLC tags for throughput and motor speed, log the drive output frequency, and log power quality at the motor control center in the same minute as the capture.
Compare spectra only at matching load, speed, and voltage state. Confirm any suspected fault with vibration, thermography, or a physical inspection before a work order goes out.
A cooling water pump that ramps with header pressure will grow sidebands every time demand rises, with no new crack in the rotor. Motor vibration analysis is the right second look when the current pattern survives that load match and still looks like a bearing or an eccentric air gap.
A 200 kW Cooling Water Pump Motor Case
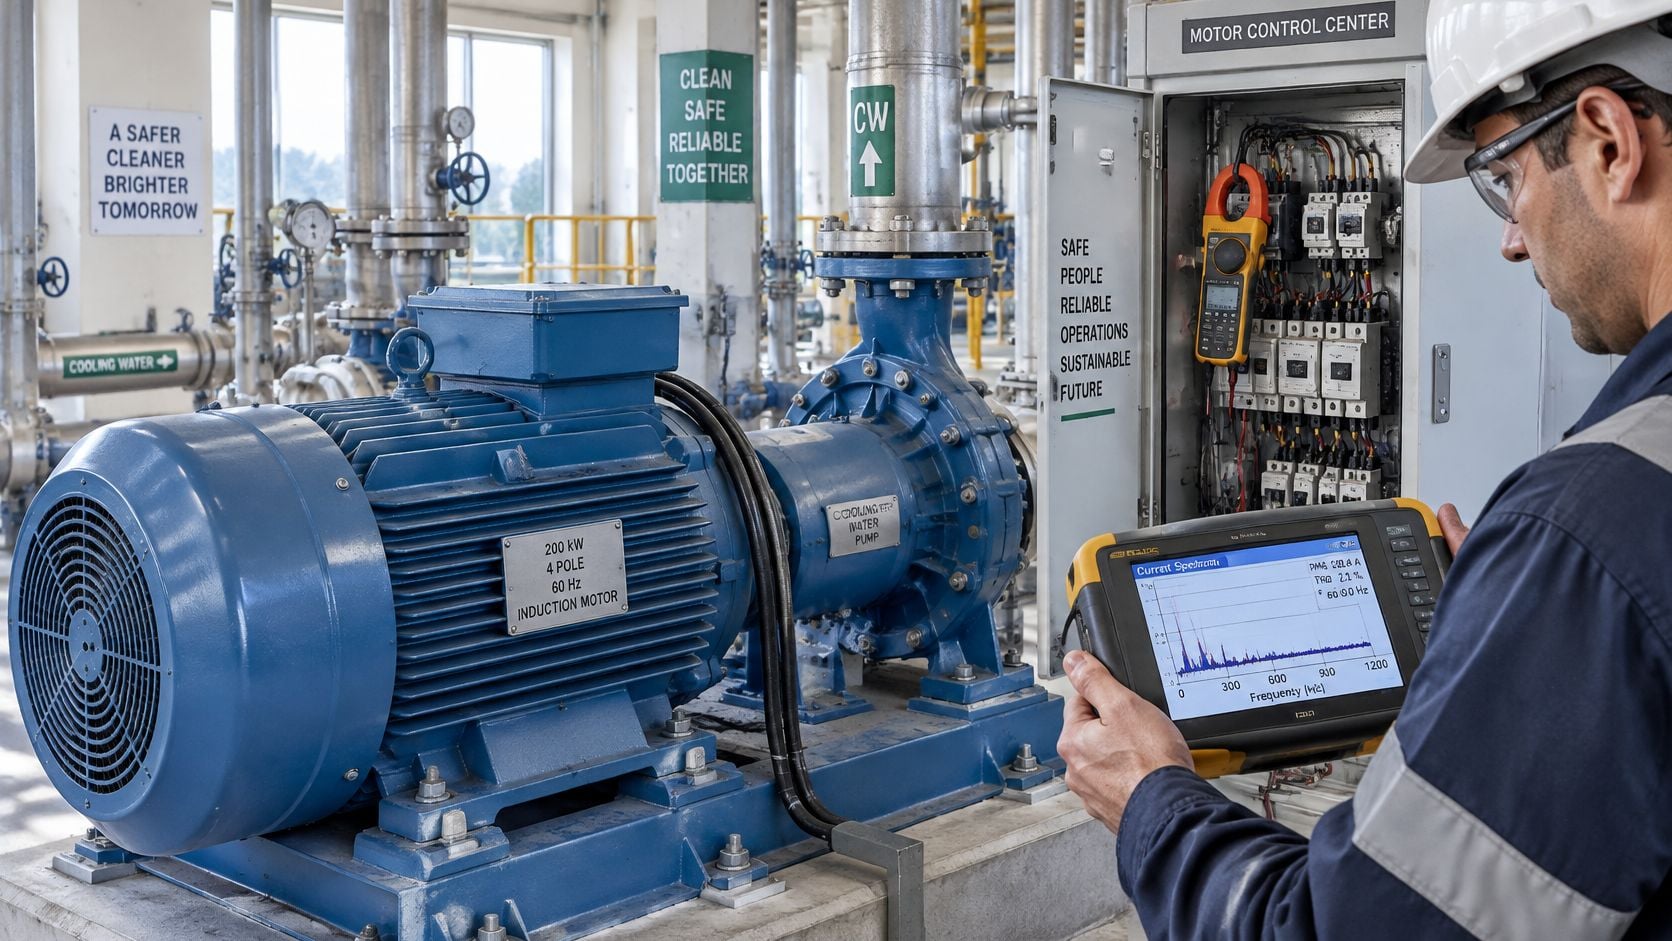
Say a chemical plant runs a 200 kW (about 270 hp), four-pole, 60 Hz induction motor on a cooling water pump. Synchronous speed is 1,800 rpm. The motor runs at 1,775 rpm, so slip is about 1.39%. Slip frequency is about 0.83 Hz. A rotor-bar defect would place sidebands near 58.3 Hz and 61.7 Hz, each about 1.7 Hz off the 60 Hz peak.
What the monthly sheets showed
Month one, both sidebands sat a few decibels above the noise floor at a steady 175 kW and unchanged pump throughput. Month two, the same pair was higher at the same kilowatts and the same flow. Month three, they had climbed again, still at that load, with header pressure and valve position unchanged. Speed stayed near 1,775 rpm, so the slip assumption hadn't drifted.
A 2024 study in the Journal of Engineering for the Advancement of Monitoring and Diagnostics reported that motor-current signals reached 87.41% accuracy on the mechanical faults under study only after signal processing and manual feature extraction. That gap is why a person still checks the frequencies by hand. An automated flag at 58 Hz could be a bar, a load step, or a processing artifact. Here the spacing matched 2sf, and the load check passed.
The outage decision
The team did not pull the motor on the third reading. They booked a vibration spectrum at running speed on the next route, and they put a rotor inspection on the next planned outage. If vibration at 1× running speed and the sideband trend agree, the rotor comes out on a scheduled window. If vibration is clean and a later current reading falls back, the alarm stays open as a watch item.
A planned rotor repair is a known crew, a known spare, and cooling restored on the outage clock. An unplanned trip takes the cooling circuit with it and can idle the line the pump serves. Cavitation or a throttled discharge can also shake a pump motor without a bar fault, so the process review includes pump cavitation causes before the rotor is condemned.
Choosing a Threshold Strategy for Multi-Site Fleets
A plant with 20 or more critical motors, spread across several sites, can't hand-tune a limit on every asset every month. Horsepower, frame, supply, drive settings, and maintenance history all differ. The detection method has to match the data the sites have.
A 2026 Brunel University framework describes the transfer problem plainly. Deep-learning performance degrades when torque load and other operating conditions change, and MCSA's discriminative power collapses at low signal-to-noise ratios and when labeled fault examples are scarce. The same work points at self-supervised and federated learning that trains on unlabeled current and vibration data across sites without sharing the raw signals. That direction is promising. It doesn't replace a decision a reliability engineer can defend this quarter.
Three strategies, picked by the data on hand
| Strategy | Use when | Minimum requirement | Main risk |
|---|---|---|---|
| Fixed engineering thresholds | Critical motors with a repeatable baseline for each motor class | A baseline in each load band and sideband limits a technician can explain | Misses new fault patterns if the baseline was taken at the wrong load or speed |
| Site-specific supervised models | A site already has confirmed, labeled fault cases | Enough labeled failures for that horsepower, construction and drive type | Discriminative power collapses when torque, signal-to-noise ratio or motor class changes, and most plants lack labels |
| Adaptive anomaly detection | Many motors have operating-context data but few historical failures | Confidence scoring, drift review after process changes, and unlabeled current for learning normal behavior | Treats a normal load swing as a fault unless spectra are compared at matching load, speed and voltage |
Fixed limits are transparent and easy to audit, and they fail without warning if the baseline was captured at the wrong load. Supervised models can separate faults well on the motors they were trained on, and they stall when a site has no historical failures to label. Adaptive detection learns what "normal" looks like, then needs a confidence score and a drift review after every process change, or a header-pressure swing becomes a rotor alarm.
The practical minimum, whatever the strategy, is documented operating context on every motor, a baseline in each load band, features a technician can explain, and confirmation by vibration or an electrical test before corrective work. For critical motors, fixed thresholds are the defensible default now. Adaptive detection can be added once data quality is proven, inside a broader condition monitoring system that already carries speed and load with the spectrum.
How to Build a Signature Monitoring Program
A program that survives the first year is a short list of motors, each read at a fixed operating state. A route built from every feeder in the plant collapses under its own data before the second quarter. The wider effort runs in stages: design a predictive maintenance program around vibration, oil analysis, and thermography, calibrated to the equipment types and the production schedule, then move to continuous monitoring with scheduled collection and analysis that catches early-stage faults before they become failures. Signature monitoring slots into that structure as one more task with an owner, a route, and a due date.
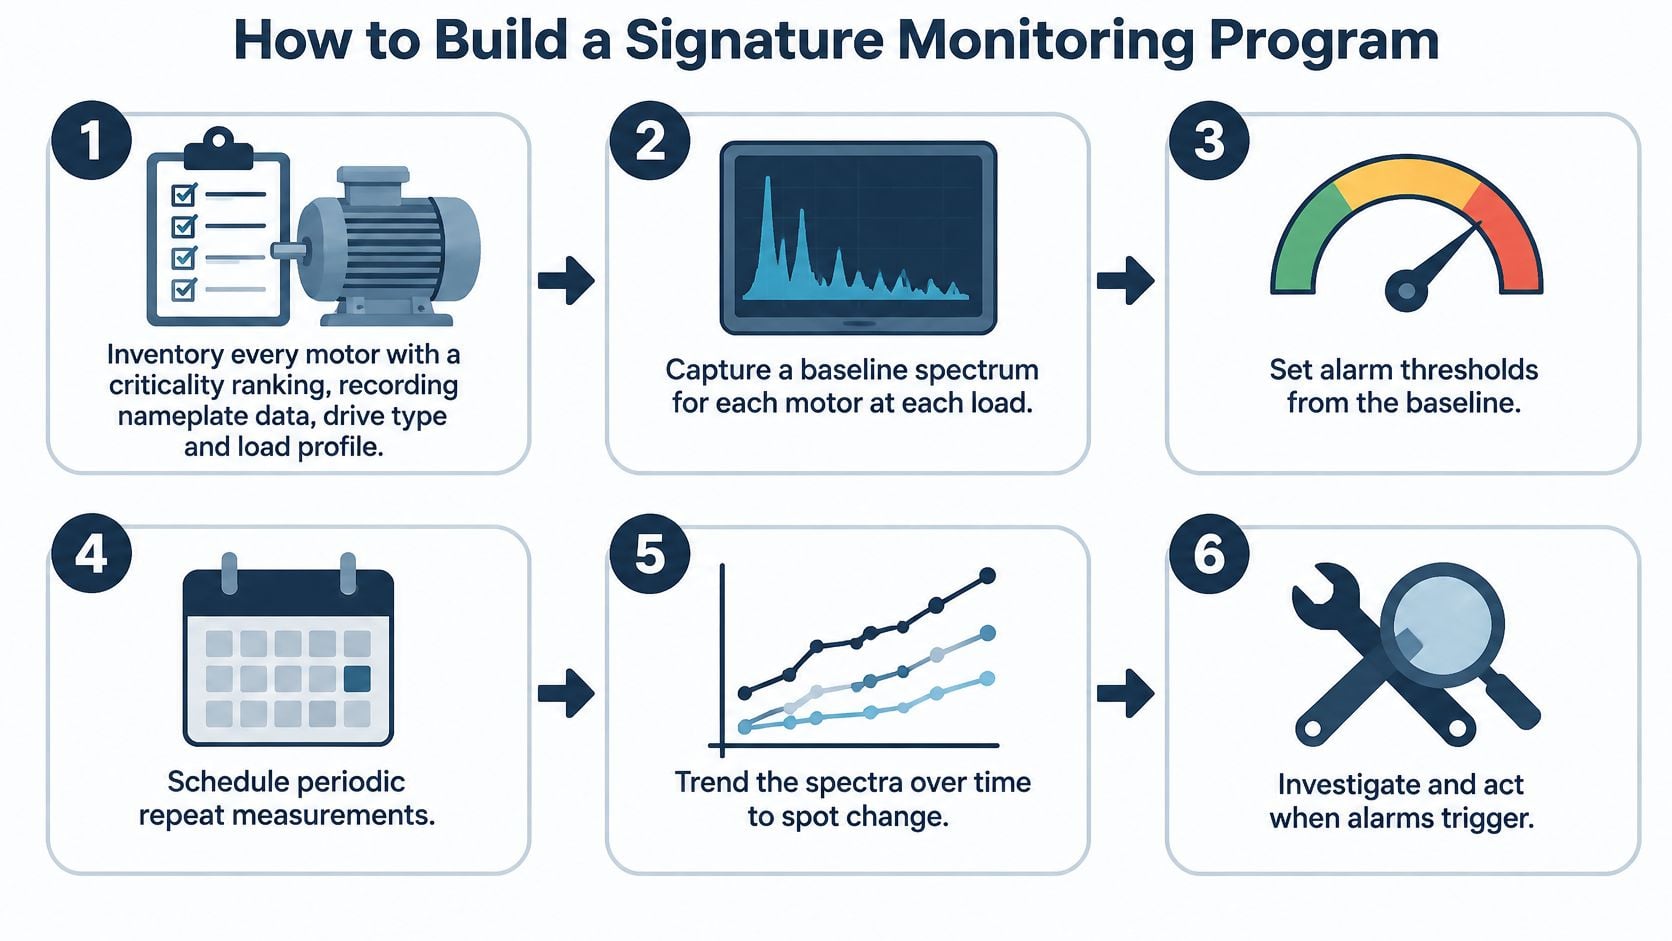
Six steps and the slip that breaks each one
- Inventory and rank. Record nameplate data, drive type, and load profile for every motor, then rank by consequence. Skipping the rank puts route time on a spare agitator and starves the cooling water pump.
- Baseline each band, with an owner. Assign one person to capture the baseline, file it where the route can reach it, and log the PLC tags for load, speed, and voltage at the moment of capture. A baseline nobody owns gets taken once and never rebuilt, and a spectrum stored without its operating point is a spectrum nobody can defend.
- Set limits from that baseline. Start with fixed alarms on sideband amplitude relative to the baseline for that band. A limit copied from a lab motor, or from one noisy capture, will either never fire or fire every Monday.
- Collect on a fixed state. Route-based readings at a written load and speed suit the wider fleet. Move only the critical drives to continuous monitoring. A route taken whenever the operator is free compares unlike spectra, and unlike spectra are how healthy motors earn alarms they never deserved.
- Write the escalation path. Name who reviews a trend that crosses the limit, who runs the confirming test, and who signs off on the work order, then put all three names on the route sheet. An alarm that lands in a shared inbox dies there. One that goes straight to a pull-and-replace wastes an outage on what may be a load change. That chain of decisions is the working core of condition-based maintenance.
- Reset the baseline after change. Rebuilds, process changes, and drive-parameter updates all move the spectrum. Fold baseline review into the same work order that approves the change, or next month's alarm flags the change itself.
The result worth aiming for is a short continuous-watch list and a route the plant will run. A few critical motors watched every cycle will always beat a long list checked whenever someone finds an hour.
Confirm Your Motor Risk Before the Next Outage
The decision for this quarter is which motors earn signature monitoring, not whether every feeder should be clamped. For induction motors, the leading concerns are bearing failure, winding insulation, and rotor bar defects, caught with MCSA and vibration together. Deeper diagnostics, including motor current signature analysis, infrared thermography, and airborne ultrasound, are priced per visit, so the list should be the assets whose failure stops production.
Gather this before any scoping conversation:
- Critical motor list with running hours and failure history.
- Driven equipment, such as a cooling water pump, fan, compressor, or conveyor.
- Nameplate data and VFD settings, including normal speed bands.
- A recent load profile in kW or process flow, not a single amp reading.
- Existing vibration or thermography records so current trends aren't read alone.
A free reliability assessment with Forge Reliability produces a ranked list of motors where current-based monitoring is likely to give actionable warnings, flags the motors that still need vibration or insulation confirmation, and shows whether current data quality supports fixed thresholds or still needs cleaner operating context. Condition monitoring programs combine vibration, oil analysis, thermography, ultrasonics, and MCSA so one technology doesn't carry the call.
Bring the motor list, the load profile, and the last three current spectra. A ranking built from those three inputs is more useful than another month of unsorted alarms.
That packet is enough to decide which cooling water pumps, fans, and process drives belong on this quarter's route, and which ones can wait.
Forge Reliability designs motor monitoring around current spectra, vibration, and the operating context that keeps those alarms honest, for plants that can't afford a false trip or a missed rotor bar. A free reliability assessment ranks the motors where signature monitoring will change the next outage plan, and it shows where the data still isn't good enough to trust. Visit Forge Reliability to request that assessment for your motor fleet.