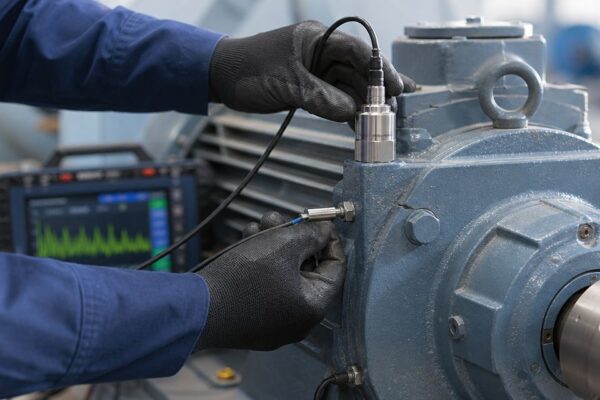
A bearing on a critical pump starts to pit on a Friday afternoon. The vibration route was last week, the historian trend looks noisy, and the work-order history says "pump failed" three times without saying which part. By the time the trip happens, the spare is in the wrong bin and the weekend crew is guessing.
That gap is what asset management technology is supposed to close. It is not a dashboard purchase. It is the chain from a trustworthy asset record to a named failure mode, a diagnostic that can see that mode early, and a work order someone can plan before the machine stops.
Table of Contents
- What Asset Management Technology Covers and Why It Matters
- The Five Core Components and the Decision Each Supports
- How the Tools Support FMEA, RCM and Predictive Maintenance
- Matching Diagnostic Techniques to Specific Failure Modes
- Selection, Integration and Data Governance Criteria
- Industry Use Cases With KPIs and ROI Examples
- Implementation Roadmap From Data Audit to Live Program
- Confirm Your Asset Data Before You Buy Technology
What Asset Management Technology Covers and Why It Matters
Asset management technology is the software, sensors, and analysis that turn equipment data into maintenance and capital decisions. It records what each asset is, how it performs, what it costs, and how likely it is to fail.
Think of the asset record as a patient chart for a machine. The chart holds identity, history, and vital signs. The reliability team decides the treatment. A vibration spike with no failure code is a fever with no diagnosis. A work order that says "replaced pump" is a discharge note that never names the illness, so the next admission starts from zero.
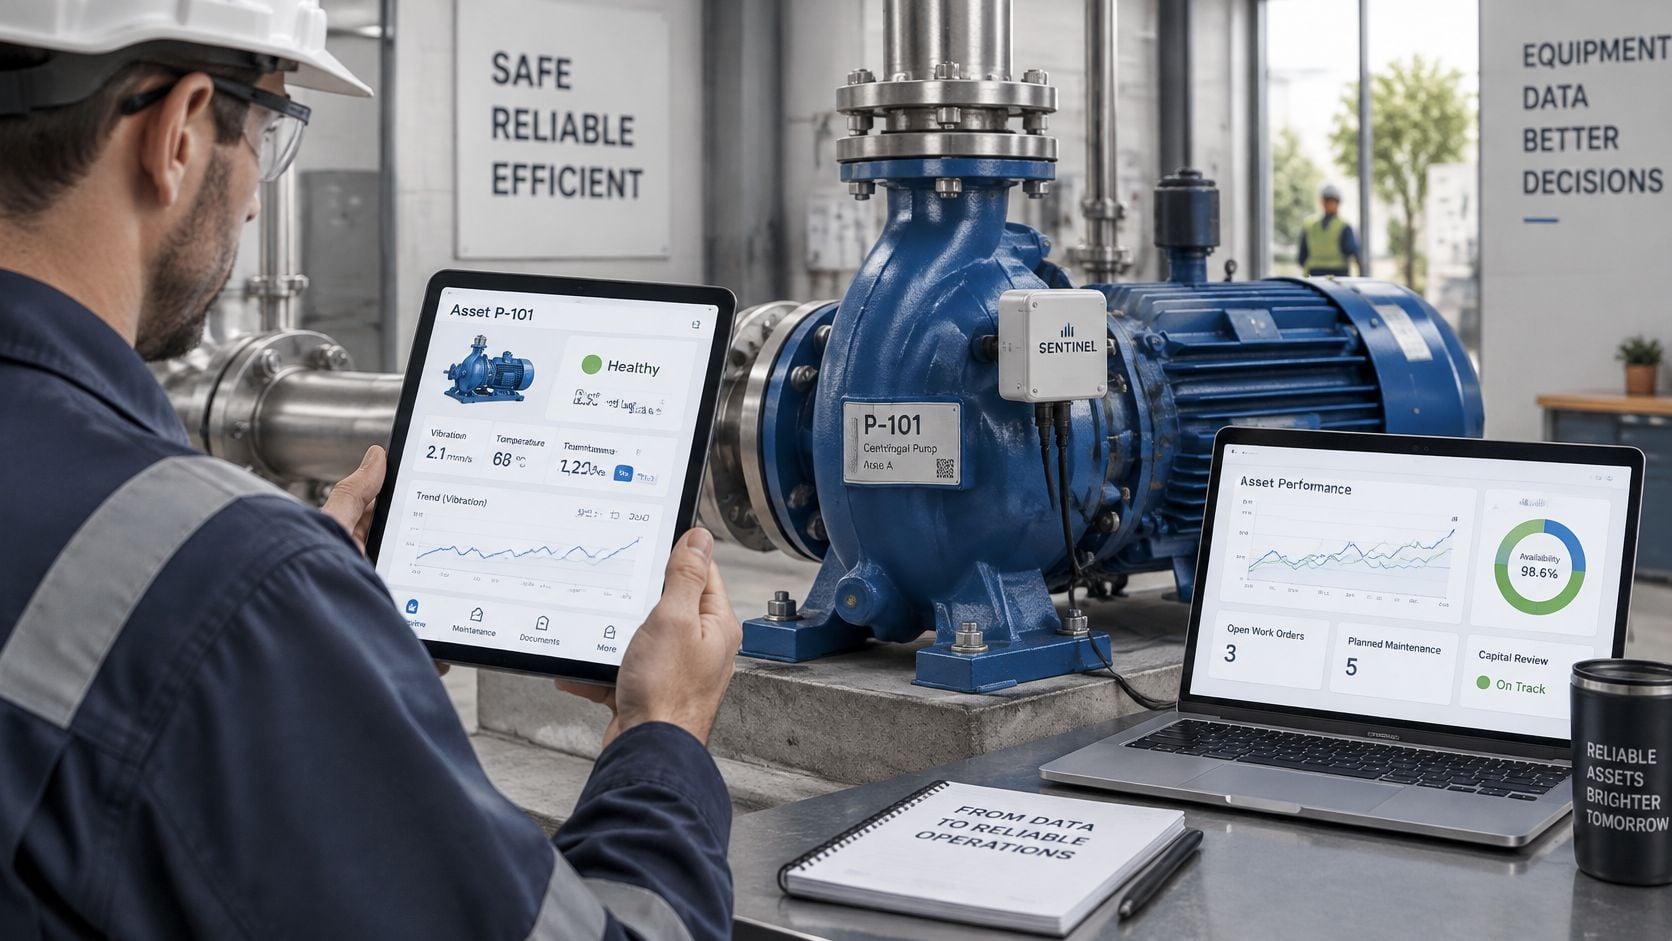
From the calendar to the condition
For decades, plants maintained on a calendar or waited for functional failure. Condition-based maintenance (CBM) changed the rule. A 2015 academic review defines CBM as using wired or wireless monitoring data to assess equipment condition, diagnose abnormalities, predict failure risk, and trigger repair or replacement before functional failure. The same review reports an estimated annual savings opportunity of approximately $35 billion from widespread CBM deployment in the United States.
That logic fits pumps, motors, compressors, gearboxes, and turbines. Vibration, temperature, pressure, oil debris, and electrical signatures can show degradation while the machine still makes product. CBM cuts inspections that the clock demanded and that the machine didn't need, and it pulls real work forward so parts and people are ready.
A measurement only reduces risk when it names a failure mode, leaves enough warning to plan, and becomes a work order or a defined inspection.
Teams that want to test recovery before outages strike already treat warning time as a design requirement, not a hope. The same standard belongs on every condition alarm.
The stack has to support a sequence of decisions: which components to trust, which failure-mode methods to use, which diagnostics match those modes, how to select and govern the tools, how to roll them out, which KPIs prove the result, and what to do first.
The Five Core Components and the Decision Each Supports
A compressor's condition alarm arrives, but the crew cannot act until they know which machine it belongs to, what the signal may mean, and what work should follow. Asset management technology connects those steps. The foundation is trustworthy asset records and clear failure-mode definitions; each tool should support a specific maintenance or operating decision.
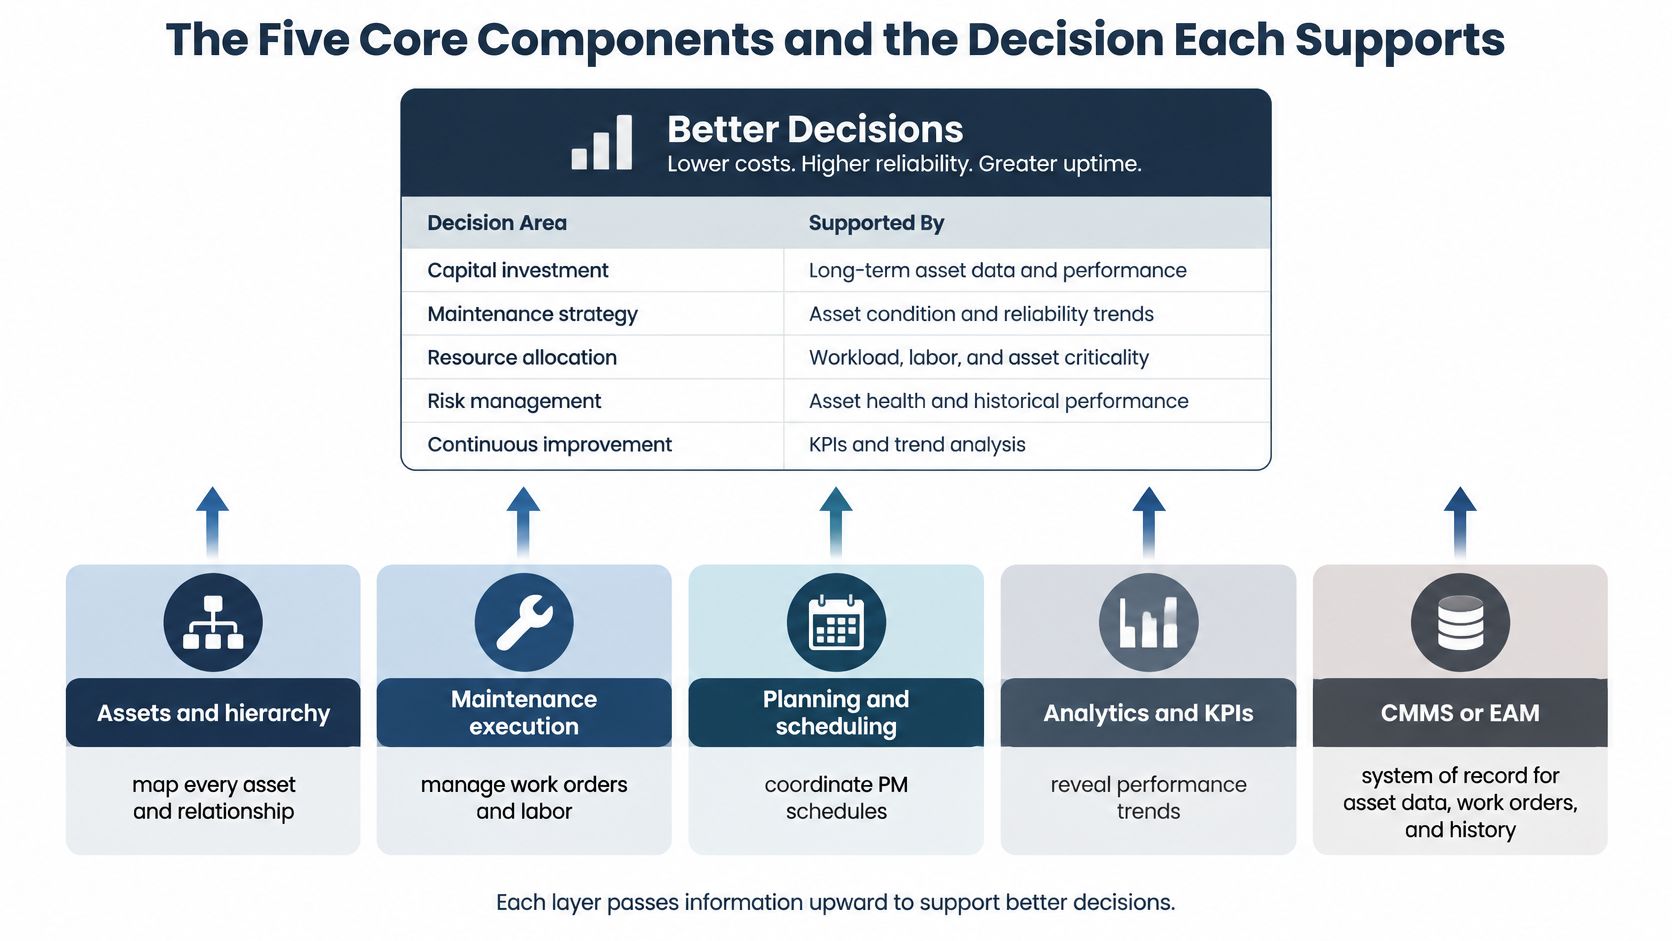
Read each row from left to right: identify what the component records, then check whether its output supports a defined decision. If no action follows, the layer adds information without guiding the work.
| Component | What it captures | Decision it supports |
|---|---|---|
| CMMS or EAM | Asset hierarchy, PM schedules, work orders, failure codes, spare parts | Who does which work, when, and with which parts |
| IIoT sensors | Vibration, temperature, pressure, speed and motor current at the machine | Whether a signal has changed enough to investigate |
| Condition monitoring | Vibration spectra, oil analysis, thermography, ultrasound, motor current signature analysis | Whether a fault exists, what type it is, and how severe it is |
| Analytics and AI | Trends across sensor and maintenance history, anomaly scores, remaining useful life estimates | When to intervene and how urgently |
| Digital twins | Connected model of asset state, operating context and alternative operating plans | Which operating or maintenance scenario reduces risk at the lowest cost |
What each layer is for
The CMMS or EAM is the system of record. It connects equipment identity and hierarchy with preventive schedules, work orders, failure codes, and spare parts. A consistent enterprise asset management structure makes it possible to compare similar assets and trace a maintenance decision back to the machine and its history.
IIoT sensors measure conditions at the machine through devices such as accelerometers, temperature probes, pressure transmitters, speed pickups, and motor-current signals. A sensor change is a reason to investigate, not a diagnosis.
Condition monitoring interprets measurements as evidence. Vibration spectra, oil results, thermal images, ultrasound, and current signatures can help distinguish a specific fault from other causes of an abnormal signal.
Analytics and AI examine trends across sensor readings and maintenance history. Their estimates can help planners set timing and urgency, but their usefulness depends on reliable records and consistent failure definitions.
A digital twin connects asset state with operating context, allowing teams to compare operating and maintenance plans. For example, a vibration increase at one speed and load may call for a different response than the same increase during startup.
One compressor, five handoffs
Suppose a gearbox-driven compressor shows gear-mesh sidebands in its vibration data. Condition monitoring assesses whether the pattern fits a gear fault or another cause, such as looseness. Analytics tracks how the signal changes with load, while the CMMS links the finding to the correct asset and records the planned work. A digital twin can compare operating scenarios, such as whether a temporary load limit supports continued operation until a planned repair.
Each handoff needs a defined purpose. A measurement must connect to an interpretable fault indication, and a maintenance decision must connect to a work order or inspection plan. Without those links, information stops at the screen.
How the Tools Support FMEA, RCM and Predictive Maintenance
Tools don't choose a strategy. Failure mode and effects analysis (FMEA), reliability-centered maintenance (RCM), and predictive tasks do. The software stores the answers and forces the next job to match them.
Three questions, then a ranking
FMEA is a fixed set of questions for each function. How can it fail, what happens, and how severe is that effect? The raw material is failure codes, maintenance history, and operating context. A failure mode is a specific physical or human cause, such as bearing lubrication loss, seal wear, impeller erosion, or shaft misalignment. "Pump failed" is not a mode. It is a headline.
Criticality ranking decides how deep you go. Score safety, production, environmental exposure, and cyber exposure. A standby lube pump that can dump oil to a drain is not the same problem as a spared cooling-water pump.
Five treatment paths
NASA's Reliability Centered Maintenance methodology requires analysts to define the intended function, identify functional failures, determine the failure modes, document the effects, evaluate the consequences, and select tasks and intervals. RCM then assigns one of five paths: predictive maintenance, preventive maintenance, failure-finding, redesign, or run-to-failure. Predictive tasks use non-intrusive tests, visual inspection, or performance data to catch impending failure. Failure-finding tasks reveal hidden failures in protective or standby functions.
Classical RCM belongs where consequences are highest. Simpler methods belong on the rest. Forge Reliability matches analysis depth the same way: classical RCM where failure consequences are highest, and simpler methods for the remaining equipment. Each RCM change goes into the CMMS as a work-order template, a PM routine, or a condition-monitoring route, so the study doesn't die in a spreadsheet.
A chemical-plant pump, four different jobs
On a centrifugal pump, one FMEA splits four modes that a calendar overhaul would treat as one machine.
- Cavitation: Look for broadband noise and unstable discharge. The task is process and hydraulic, not a new bearing.
- Seal leakage: Look for weep rate and product in the drain. The task is a planned seal change with the right faces.
- Bearing degradation: Look for defect frequencies. The task is a predictive route or an online sensor, plus a planned cartridge change.
- Motor insulation failure: Look at current signature and temperature. The task is electrical, and it may end in a motor rewind decision rather than a pump overhaul.
Data moves in one direction. CMMS failure codes feed the FMEA. Condition data confirms that a predictive task still sees the mode. Each RCM outcome becomes a template, a PM, or a route. A practical FMEA for manufacturing assets starts from those codes, not from a generic library pasted onto every tag.
Sensors without defined modes produce alarms nobody can act on. The technician sees a number. The planner sees no part, no procedure, and no due date.
Matching Diagnostic Techniques to Specific Failure Modes
A diagnosis is a pattern, not a single number. A high overall vibration reading says the machine is unhappy. It doesn't say why.
NASA's machinery diagnostics guidance identifies frequency-spectrum analysis as the most commonly used machinery-diagnostic method, and treats FMEA as the way to decide what parts fail, why, and how that affects the system. A spectrum turns a time waveform into frequency components so a technician can tie recurring peaks to imbalance, misalignment, looseness, or bearing impacts. Readings have to be taken at comparable load and speed and set against the machine's baseline. Startup, a process upset, and steady load are three different machines.
Rotating faults first
Walk the table the way a technician walks a route. Rotating faults come first, because they dominate gearboxes, motors, and coupled pumps. Fluid and electrical faults come next.
| Failure mode | Early signal | Primary technique | Typical warning window |
|---|---|---|---|
| Rolling-element bearing defect | Defect frequencies and impact peaks in the spectrum; rising ultrasonic energy | Vibration spectrum, ultrasound | Often weeks to months |
| Shaft misalignment | Strong second harmonic of running speed, high axial vibration | Vibration spectrum, phase analysis | Often weeks |
| Imbalance | Dominant peak at running speed, mainly radial | Vibration spectrum | Often weeks |
| Gear mesh wear | Gear-mesh frequency with sidebands | Vibration spectrum, oil analysis | Often weeks to months |
| Lubrication degradation | Wear debris, viscosity change, rising bearing temperature | Oil analysis, thermography | Often weeks to months |
| Pump cavitation | Broadband noise, erratic discharge pressure, ultrasonic noise | Ultrasound, pressure trend | Often days to weeks |
| Motor rotor or stator fault | Sidebands around line frequency, current imbalance | Motor current signature analysis | Often weeks to months |
| Electrical connection hot spot | Temperature anomaly at terminals and joints | Thermography | Often hours to weeks |
On a gearbox-driven compressor, a rising gear-mesh component with sidebands supports a planned inspection. An unrelated broadband rise points toward looseness or bearing damage instead. Those are different work orders, different parts, and different response times.
From pattern to job
Planners should turn a confirmed pattern into a failure-mode-specific work instruction, a severity threshold, the spares that job needs, and a response time. An alarm is not an automatic replacement command.
Some modes never show up well online. Oil analysis catches viscosity and debris that a monthly spectrum can miss. Ultrasound on a route catches early bearing energy and leak noise before the spectrum is obvious. Cavitation can move from "audible" to "impeller damage" in days, while a spalled bearing often gives weeks. Warning windows in the table are planning ranges, not guarantees. Speed, load, and lubrication quality change them.
On assets already on the critical list, add the technique that detects the failure mode with the largest consequence first. Don't instrument the easy measurement and leave the expensive mode blind.
A condition monitoring program earns its keep when each route or sensor is tied to one of these rows, with a person who knows what "act" means for that row.
Selection, Integration and Data Governance Criteria
A vibration alarm appears for “P-101,” but the CMMS lists the same machine as “North Line Pump 3.” Until those records point to the same asset and describe the same failure mode, the alarm cannot reliably become the right work order. Asset-record trustworthiness is the first investment; sensors and analytics depend on it.
Industrial research identifies incomplete or inconsistent data as a barrier to applying AI analytics. In practice, the problem often starts with mismatched asset names, unclear parent-child relationships, or work orders that record “broken” without describing what failed.
What makes an asset record usable
Check whether the CMMS, historian, ERP system, and condition-monitoring system describe the same equipment consistently. Each field supports a different decision:
- Tag names: Match the equipment across systems so a reading reaches the correct asset record.
- Parent-child relationships: Keep the motor, coupling, gearbox, and driven machine connected in one hierarchy. This lets a team trace a symptom to the equipment that may need work.
- Failure codes: Record specific failure modes rather than broad labels such as “broken” or “other.” Without a clear mode, analysts cannot reliably compare failures or choose maintenance tasks.
- Bills of material and meter readings: Confirm that listed parts match the equipment and that runtime readings support maintenance intervals.
- Work-order history: Record what technicians found and what they did. A closed work order without those details provides little evidence for future decisions.
If the same motor frame appears under three codes across multiple sites, a bad-actor list may count names rather than machines. Standardize asset records and failure-mode definitions before using those records to rank risk or train an alarm model.
Seven gates before you buy or connect
- Can an alarm create a CMMS work order with the relevant asset and failure code?
- Are model results checked against labelled failures, rather than judged only by smooth trends?
- Can the system support both route-based checks and continuous monitoring?
- Are sampling rates suited to the fault frequencies that matter, including bearing and gear-mesh components?
- Are monitoring connections read-only and separated from control networks?
- Is remote analyst access controlled, with sensors and gateways inventoried?
- What does the system do if cloud connectivity drops: continue local alarming, fall back to routes, or stop reporting?
The answers should reflect the decision the tool supports. A model that detects a change but cannot identify the asset or failure mode may generate alerts without useful work orders. Rank assets by safety, production, environmental, and cyber exposure before connecting them; a per-tag license is not a reason to monitor every asset.
The 2025 ICS/OT security survey reported that 22% of organizations experienced a cybersecurity incident during the previous year, 40% of those incidents caused operational disruption, and nearly 20% took more than a month to remediate. Monitoring connections can create additional paths to a drive or a PLC-adjacent gateway. Keep monitoring read-only and off the control network, inventory each sensor and gateway, and govern remote access.
Route-based vibration, ultrasound, thermography, or oil analysis can suit assets that are spared, have failure modes that develop over weeks, or operate where sensors are difficult to maintain. Routes can also be a practical choice while asset hierarchies are being corrected, because automated alarms depend on the right record to reach the right work order. Choose the method according to the failure mode and the decision it must support.
Industry Use Cases With KPIs and ROI Examples
Failure doesn't cost the same thing in every industry. The asset, the mode, and the KPI have to match, or the business case argues about wrench time while the actual loss is scrap, a trip, or an emergency part.
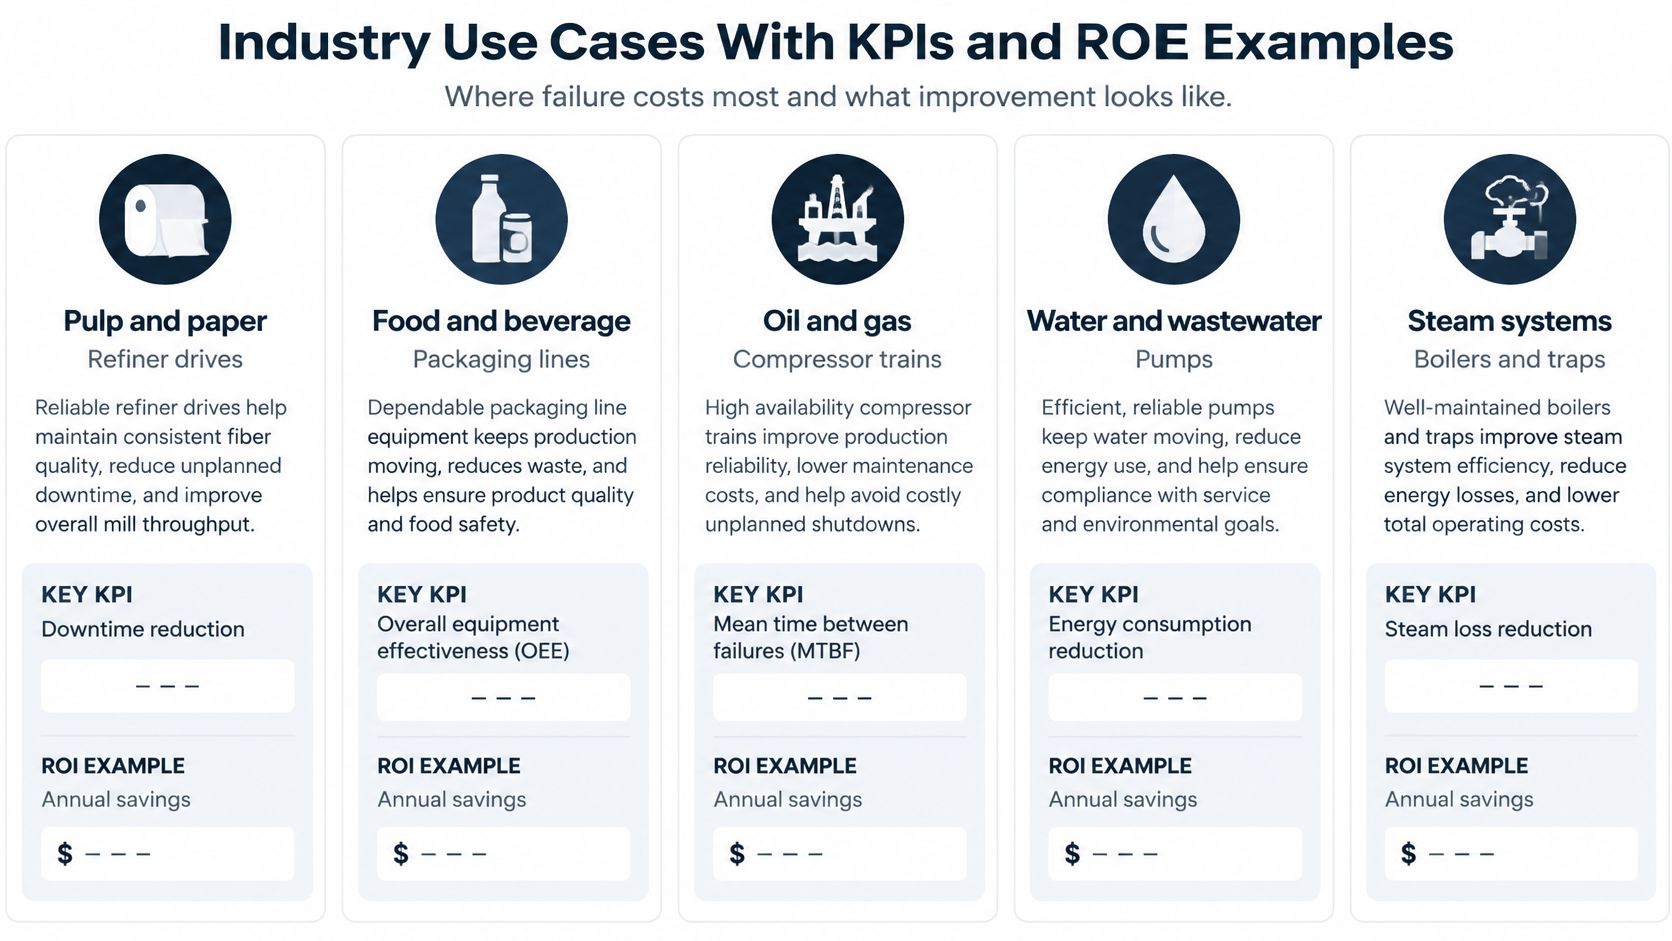
| Industry | Critical asset | Typical failure mode | KPI to track | ROI logic |
|---|---|---|---|---|
| Oil and gas | Compressor trains and pumps | Bearing and seal failure | Unplanned downtime hours | Avoided outage hours times lost margin per hour |
| Food and beverage | Packaging-line motors and conveyor gearboxes | Gearbox and bearing failure causing product defects | Defect rate and unplanned line stops | Avoided line stops plus avoided scrap and rework |
| Pulp and paper | Refiner drives and motors | Bearing wear and motor insulation faults | Mean time between failures | Avoided outages plus fewer emergency parts purchases |
| Water and wastewater | Lift-station and process pumps | Impeller erosion and seal leakage | Pump availability percentage | Avoided emergency callouts and overflow events, counted only when no backup pump covers the duty |
| Power generation | Steam turbines | Blade condition change and trip events | Forced outage hours | Avoided forced outage hours at replacement power cost |
| Chemical processing | Centrifugal pumps | Cavitation and seal leakage | Planned-to-reactive work ratio | Value of moving seal and cavitation repairs onto the planned schedule |
Three KPIs, then the multipliers
Unplanned downtime hours measure surprise stops. The planned-to-reactive work ratio shows whether condition tasks are replacing breakdown jobs. Mean time between failures shows whether the modes are slowing down. Food and pharmaceutical lines should add defect rate and spares cost, because a failed bearing becomes contaminated product and a panicked purchase.
NIST reported that manufacturing establishments relying heavily on reactive maintenance experienced 3.3 times more downtime and 16.0 times more defects than establishments with less reactive practices. The same reactive group had 2.8 times more lost sales attributable to maintenance-related defects and 4.89 times more inventory increases associated with maintenance problems. A packaging-line gearbox or a process-pump bearing isn't only a maintenance event. It becomes scrap, a late order, expedited freight, and a bloated storeroom.
A separate review of oil-and-gas predictive-maintenance work reported annual savings of $100,000 to $300,000 per facility and equipment-downtime reductions of 10% to 25% in the implementations it covered, as summarized in a Springer systematic review. Those ranges only transfer to your site after you know your own baseline.
A labelled example, not a promise
ROI is avoided downtime hours times lost margin per hour, plus avoided defect, rework, and expediting cost, minus technology and labour cost.
Say a compressor train avoids 20 hours a year and lost margin is $10,000 an hour. That is $200,000. Subtract $60,000 of monitoring and analysis. The illustrative net is $140,000. Those inputs are placeholders. If the plant never recorded downtime, margin, and defect cost before the program, the figure is unknown until the data audit is done. Don't backfill it.
Tie the KPI you improve to overall equipment effectiveness only where availability, quality, or rate is the loss you measured. A seal-leak program that cuts reactive jobs may not move OEE if the pump was spared the whole time.
Implementation Roadmap From Data Audit to Live Program
Each step earns the next one. Buying monitors before you know which assets hurt you, or which codes are fiction, produces a pilot that can't be judged.
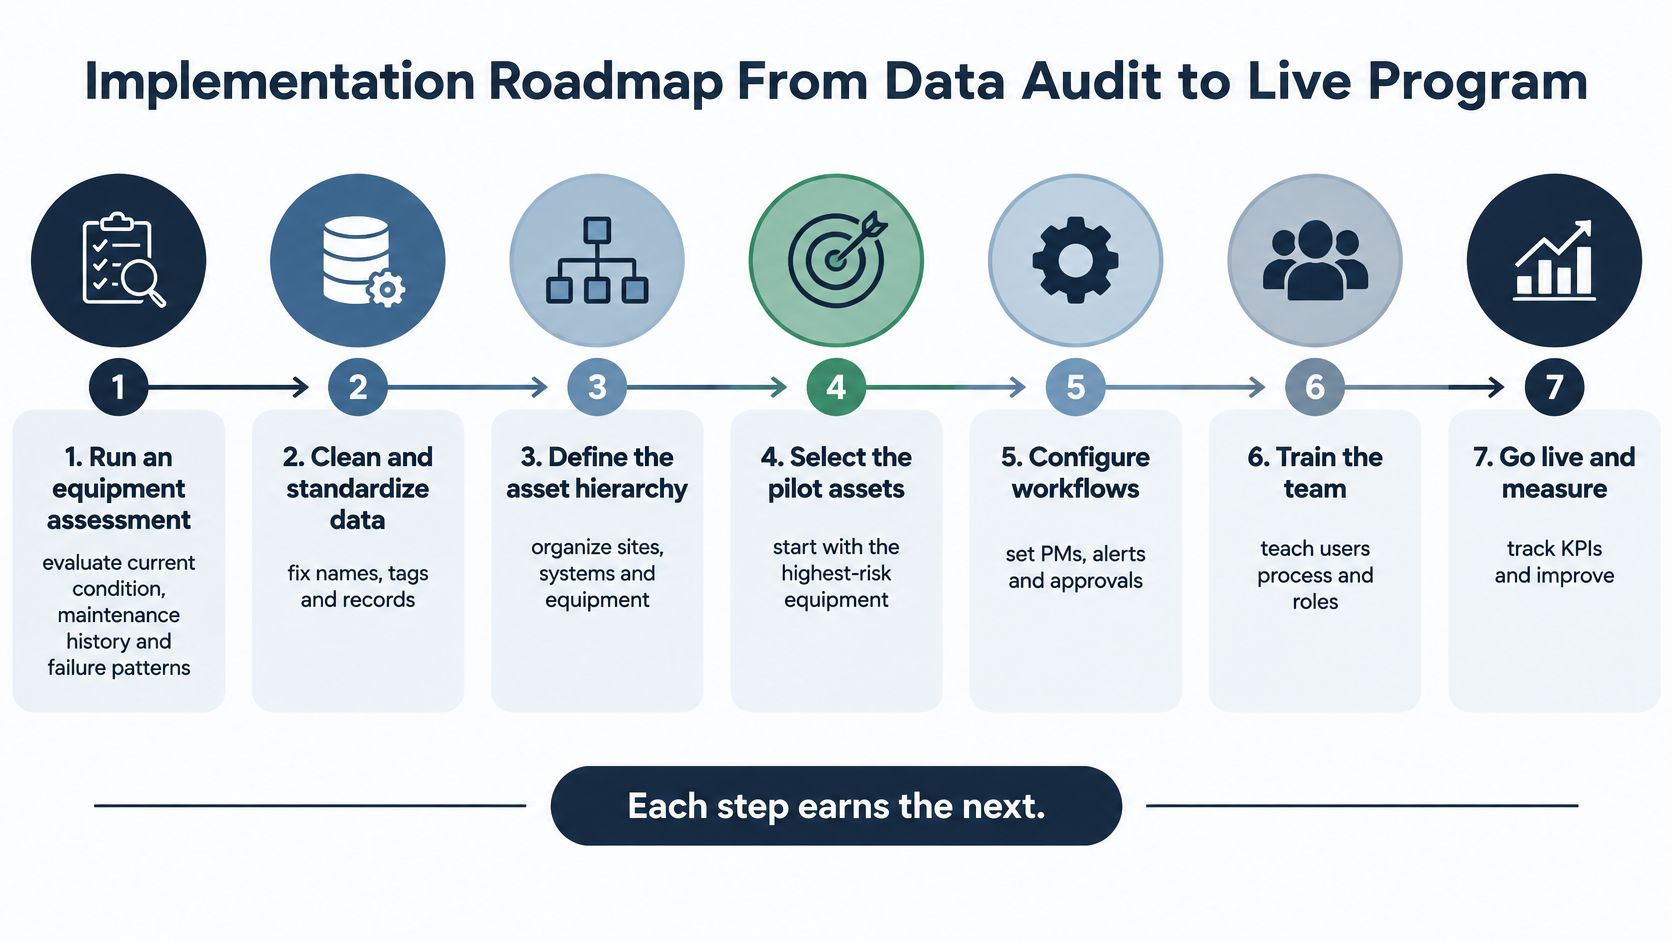
- Run an equipment assessment. The first step of a reliability program is an equipment assessment that evaluates current condition, maintenance history, and failure patterns to identify the highest-risk assets. Forge Reliability starts there so the list is based on condition and history, not on whichever area shouts loudest.
- Audit hierarchy, failure codes, and work-order quality on that short list, and merge duplicate records. A bad parent-child link makes every later KPI lie.
- Measure the maintenance mix before you set a target. NIST's national survey of U.S. manufacturing found average maintenance work split among 17.3% predictive maintenance, 31.8% preventive maintenance, and 45.7% reactive maintenance. Classify your own work orders the same way. Predictive work uses vibration, temperature, lubricant condition, or motor current to find a developing fault. Preventive work happens because the calendar said so.
- Rank by criticality and run FMEA on the top tier before you buy anything. The mode tells you whether you need a route, a sensor, a redesign, or permission to run to failure.
- Pilot one decision. Catch bearing degradation early enough to schedule a planned outage. Write down sensor quality, sampling rate, the data owner, and the exact work order each alert opens.
- Validate against real failures, downtime avoided, and cost. Tune thresholds. An alarm that never matches a teardown finding is noise.
- Scale only to other critical assets, and choose route-based or continuous monitoring by consequence. A spared pump with a slow bearing mode stays on a route. An unspared compressor with a fast seal or bearing risk earns continuous coverage.
Phase length follows site size and asset count. There is no honest universal calendar.
Do not scale until the pilot has changed at least one planning decision: a different date, a different part, or a job that used to be reactive and is now on the schedule.
A CMMS implementation guide for maintenance teams is the companion to steps 2 and 5. The hierarchy and the work-order template are the product. The sensor is the input.
Confirm Your Asset Data Before You Buy Technology
Pull the list of your most critical assets. Open the records behind them: hierarchy, failure codes, and the last three years of work orders and meter readings.
Apply one rule. If the record can't answer what failed, how often, and what was done, the first investment is governance, not sensors. A new accelerometer on a tag named three different ways will file its alarm against the wrong parent, and the planner will close it as a nuisance.
Programs of this type are built for plants with 20 or more critical assets, such as pumps, compressors, motors, gearboxes, and turbines. Forge Reliability's team has worked on hundreds of similar assets, which matters when the question is whether a pattern is a real mode or a bad installation.
A free reliability assessment reviews current equipment condition, maintenance history, and failure patterns, then names the highest-risk assets. It also checks asset-data quality, CMMS governance, and whether continuous monitoring or a route is the right mix. You leave with a ranked list, a data-readiness verdict, and a recommended first pilot. That is enough to spend the next dollar on the layer that can change a work order.
Request your free reliability assessment at Forge Reliability.
Forge Reliability helps plant teams connect asset records, failure modes, and diagnostics so condition data becomes planned work instead of another unread alarm. The engagement starts with a no-cost reliability assessment of condition, history, and the highest-risk gaps on pumps, compressors, motors, gearboxes, and turbines. Visit Forge Reliability to request the assessment and get a ranked starting point before you buy more technology.