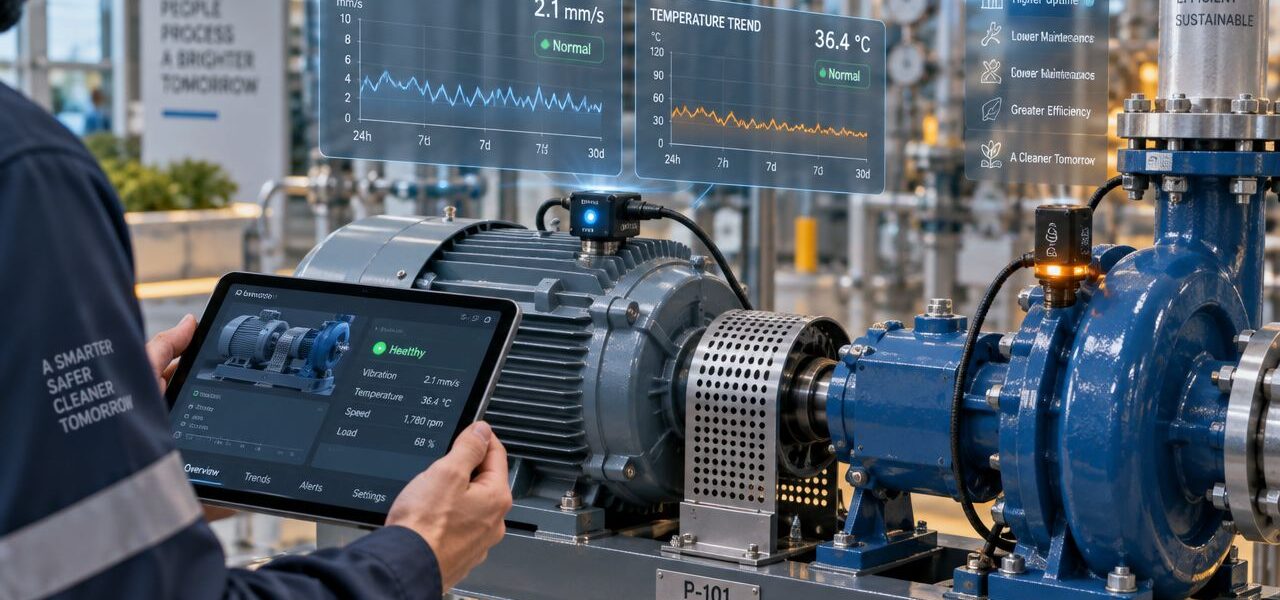
A maintenance team approves a predictive maintenance budget, installs sensors across the plant, and expects fewer breakdowns. Six months later, the dashboard is full, the planner ignores half the alerts, and the motor that justified the project still fails during production. That pattern is common because most plants treat predictive maintenance for industrial equipment as a technology purchase instead of a plant operating model.
The decision isn't whether to buy vibration sensors, thermal cameras, or analytics. The decision is how a plant will turn condition data into inspection tasks, planned work, parts staging, and shutdown timing. The plants that get value from predictive maintenance build ownership, escalation rules, and CMMS workflows before they scale data collection.
A condition-based approach matters because it changed maintenance from fixed intervals to asset-specific intervention, and modern results explain why that shift stuck. Predictive maintenance is associated with a 20 to 30% reduction in overall maintenance costs, a 15 to 25% reduction in unplanned downtime costs, and a 10 to 15% extension in equipment lifespan for industrial motors and other rotating assets, according to predictive maintenance statistics summarized here. In a plant where a failed induced draft fan, ammonia compressor, or process pump can disrupt production for hours, those aren't abstract gains. They affect uptime, spare parts, and labor deployment.
Table of Contents
- Why Predictive Maintenance Is an Operating Model, Not a Sensor Stack
- Choosing and Combining the Right Diagnostic Technologies
- Route-Based vs Continuous Monitoring for Industrial Equipment
- Scoping a Pilot with FMEA, RCM, and Criticality Ranking
- From Signal to Work Order, Diagnostics on Real Equipment
- KPIs and ROI Calculations That Hold Up to Scrutiny
- Pitfalls That Derail Predictive Maintenance Programs
Why Predictive Maintenance Is an Operating Model, Not a Sensor Stack
At 2:00 a.m., a vibration alert fires on a production-critical pump. Operations keeps running because no one trusts the threshold. Maintenance sees the alert at shift change, but there is no rule for who confirms it, whether the asset gets inspected that day, or how the planner should rank it against existing work. By the time the pump comes apart, the plant does not have a sensor problem. It has a decision-making problem.
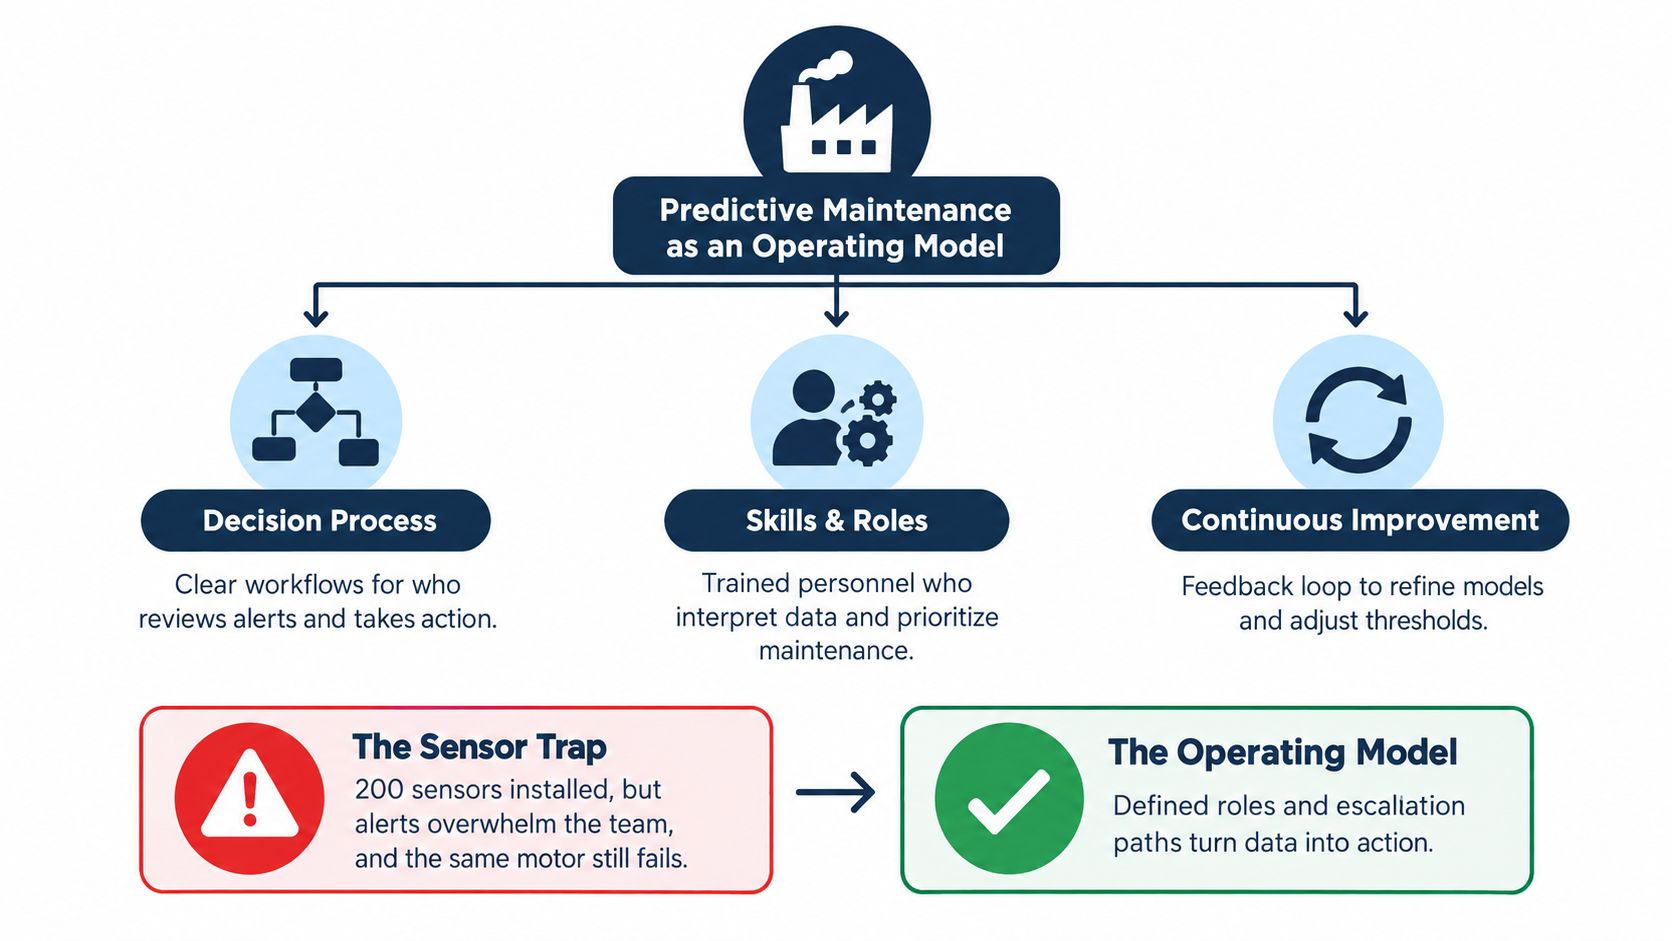
That is why predictive maintenance succeeds or fails as an operating model on the plant floor. Sensors collect evidence. People decide what counts, what gets verified, what becomes planned work, and what waits for shutdown. If those decisions are undefined, more devices only create more noise.
The four pillars that matter
Four operating-model pillars decide whether a PdM program produces useful work or buries the team in alerts.
- Governance: Assign one owner for thresholds, alarm rationalization, and recurring alert review. Plants that let multiple people tune limits ad hoc destroy signal quality fast.
- Roles: Keep responsibilities separate. Analysts diagnose. Operators confirm process context. Planners turn validated findings into scheduled work. Supervisors decide production impact and timing.
- Workflows: Every alert needs a defined path from detection to validation to work order to closeout feedback. If that path is missing, the dashboard fills up and the backlog gets worse.
- Integration: Condition findings must live inside the maintenance system, not beside it. If PdM sits outside the plant's enterprise asset management workflow, the work dies in email threads, screenshots, and forgotten notes.
What the plant floor needs
A plant with washdown motors, centrifugal pumps, and utility fans does not need continuous monitoring on everything. It needs rules that fit asset consequence and failure behavior.
Start with three decisions. Which assets can stop production, create safety exposure, or cause expensive secondary damage. Which assets can be covered well enough on routes. Which assets should stay on basic preventive maintenance because failure consequence is low and more monitoring will not change the response.
That is the operating-model view most plants miss.
Use continuous monitoring on true critical assets where early warning changes the plan. Use route-based collection on the larger population where periodic checks are enough to catch degradation before failure. Skip low-consequence assets that add data volume without changing maintenance decisions. This is how you avoid alert fatigue before it starts.
Practical rule: Do not collect any condition data unless the plant has already defined who reviews it, how fast they respond, and what action follows a validated finding.
Plants get better results with a hybrid model because the plant floor runs on labor availability, shutdown windows, and planner discipline, not on sensor count. Route versus continuous monitoring is not a technology argument. It is an operating choice tied to criticality, failure modes, and the plant's ability to act on what it finds.
Choosing and Combining the Right Diagnostic Technologies
A maintenance team installs vibration sensors on a chronic problem asset, then waits for the program to fix itself. Six months later, the team has more graphs, the same failures, and a growing backlog of alerts nobody trusts. The problem is rarely the sensor. The problem is choosing technologies without tying them to failure modes, review cadence, and maintenance action.
Choose diagnostics the same way you choose PM tasks. Match the method to the failure you need to catch, the asset behavior on the plant floor, and the skill level of the people reviewing the results. A gearbox does not need the same stack as a switchgear lineup. A steam trap survey does not need the same approach as a paper machine bearing train.
What each technology is good at
| Technology | Failure Modes Detected | Best-Fit Equipment | Key Limitation |
|---|---|---|---|
| Vibration analysis | Imbalance, misalignment, looseness, bearing defects, resonance, some gear faults | Motors, pumps, fans, compressors, gearboxes | Needs repeatable measurement points and competent analysis |
| Oil analysis | Wear debris, lubrication breakdown, contamination, viscosity shift | Gearboxes, hydraulic systems, circulating oil systems, large bearings | Confirms wear and lubricant condition, but does not pinpoint the fault location on its own |
| Infrared thermography | Hot connections, overloaded circuits, refractory loss, friction heating | MCCs, switchgear, panels, bearings, steam systems | Temperature readings can mislead if load and operating condition are ignored |
| Airborne and structure-borne ultrasound | Compressed air leaks, steam trap issues, early bearing friction, electrical arcing | Bearings, steam systems, compressed air, electrical assets | Results depend heavily on collection technique and background noise control |
| Motor current signature analysis | Rotor bar defects, eccentricity, electrical imbalance, some load-related issues | Induction motors, especially process-critical drives | Strong support method, weak standalone program |
Use fewer technologies, better.
For rotating assets, vibration and oil analysis cover the most ground with the least overlap. Vibration shows dynamic behavior. Oil analysis shows wear, contamination, and lubricant condition. On a critical gearbox, that pairing gives the maintenance team two different views of the same failure path, which is far more useful than piling on extra channels that nobody reviews with discipline.
For electrical distribution and utility losses, thermography and ultrasound are the practical pair. Thermography finds heat problems under load. Ultrasound catches leakage, discharge, and friction before heat becomes obvious. Plants that want to connect those findings to broader risk screening should review this predictive safety analytics guide, especially when the goal is to turn scattered findings into a ranked action list.
Motor current belongs in a narrower role. Use it where motor and driven-equipment behavior interact, such as critical process drives with electrical quality issues, frequent load swings, or repeated motor failures with no clear mechanical root cause. Do not build a whole PdM program around it unless the site has the skill to interpret it and the asset base to justify the effort.
Selection criteria that stop bad buying decisions
Three questions should drive the choice.
- Which failure mode do you need to catch early enough to change the maintenance plan
- What operating or environmental conditions will distort the reading
- Who reviews the data, how often, and what work order follows a validated finding
That last question matters most. A diagnostic method that no one can review consistently is waste. A method that produces a smaller number of clear, actionable findings is better for most plants than a richer signal stream that floods the team.
A dusty conveyor drive may deserve route-based vibration and periodic oil sampling. A VFD-driven cooling tower motor may justify vibration plus motor current review because electrical and mechanical faults can mask each other. If your team needs a structured way to choose methods by asset type and failure mode, use documented condition monitoring system selection criteria instead of buying whatever produces the most dashboards.
More channels do not improve decisions. Better coverage of the right failure modes does.
Route-Based vs Continuous Monitoring for Industrial Equipment
This decision should be made asset by asset, not ideology by ideology. Route-based monitoring is efficient when fault progression is slow, access is manageable, and the asset isn't production critical. Continuous monitoring is justified when failure cost is high, operating conditions change quickly, or missing the warning window isn't acceptable.
A wastewater plant offers a good example. A duty-standby pump pair serving a noncritical transfer loop usually fits route-based monitoring. The main influent pump or a critical aeration blower often deserves continuous monitoring because the process consequence of failure is far higher.
The side-by-side comparison
| Dimension | Route-Based Monitoring | Continuous Monitoring |
|---|---|---|
| Data collection frequency | Periodic, based on route schedule | Ongoing, event-sensitive |
| Best use case | Medium- and lower-criticality assets with stable operation | High-criticality assets with severe duty or rapid consequence of failure |
| Analyst workload | Concentrated during collection and review cycles | Spread across daily alarm management and exception review |
| Installation burden | Lower upfront complexity | Higher upfront integration and configuration work |
| Failure-mode fit | Good for trends that develop over time | Best when changes between route intervals would be costly to miss |
| Typical ownership model | In-house collector or service route | Dedicated analyst review with stronger governance |
The default model that works in real plants
The best default is hybrid. Put Tier 1 assets on continuous monitoring. These are the assets identified through FMEA as capable of causing major production loss, safety exposure, environmental impact, or expensive collateral damage. Put Tier 2 and Tier 3 assets on routes. Keep Tier 4 assets off the PdM program unless a recurring problem proves they belong.
That structure protects analyst time. It also keeps plants from burying high-consequence alerts under a giant stack of low-value trend points.
ISO 20816 gives maintenance teams a practical vibration trigger on rigid-mounted machines in the 15 to 300 kW range. Velocity below 1.4 mm/s RMS is considered new-machine condition, 1.4 to 2.8 mm/s RMS supports unrestricted long-term operation, 2.8 to 4.5 mm/s RMS requires planned remedial action, and above 4.5 mm/s RMS may cause damage, as outlined in this ISO 20816 vibration severity summary. That kind of threshold is useful when setting route escalation rules and continuous alarm bands on pumps, motors, and fans.
Plants comparing architectures should keep the question simple. Which assets need constant visibility, and which ones only need disciplined trend collection supported by appropriate vibration analysis tools and analyst review.
Scoping a Pilot with FMEA, RCM, and Criticality Ranking
Most predictive maintenance pilots fail before the first reading is collected. The scope is usually wrong. Plants choose assets because they're easy to access, politically visible, or bundled into a sensor package. That is backwards.
A pilot should start with documented failure consequences. FMEA means Failure Modes and Effects Analysis. It forces the plant to identify how an asset fails, what happens when it does, and which signals can catch that degradation early. RCM means Reliability-Centered Maintenance. It helps determine whether predictive work, preventive work, redesign, or run-to-failure is the right response.
How to scope the first wave
Start with the top critical assets from the site criticality ranking. Then narrow hard. The pilot should stay inside one plant area and one asset class if possible. A compressor pilot should not also include a handful of conveyors, chillers, and turbines just because they are nearby.
The failure mode has to determine the diagnostic method. A bearing-driven failure mode points to vibration or ultrasound. Lubrication contamination points to oil analysis. Electrical asymmetry points to motor current review.
| Failure Mode | Diagnostic Technique | Pilot Asset Count | Success Metric |
|---|---|---|---|
| Bearing wear in process pumps | Vibration analysis | 4 | Actionable defect identification before breakdown |
| Gear wear in enclosed reducers | Oil analysis plus vibration | 3 | Confirmed wear trend tied to inspection findings |
| Rotor electrical defect in critical motors | Motor current signature analysis | 2 | Verified electrical anomaly with maintenance follow-up |
| Cavitation in centrifugal pumps | High-frequency vibration review | 3 | Repeated detection tied to process or mechanical correction |
What success should look like
The pilot needs hard gates, not vague optimism.
- Relevance: Findings should map to real failure modes already documented by the maintenance team.
- Actionability: The team should generate work that planners can schedule, not just interesting plots.
- Governance fit: The workflow has to survive normal production pressure.
A plant that wants reliable scope discipline should anchor the pilot to an existing FMEA process for manufacturing rather than an instrument list. That keeps the effort diagnostic-driven instead of hardware-driven.
The pilot isn't there to prove sensors can collect data. It's there to prove the plant can turn condition evidence into better maintenance decisions.
From Signal to Work Order, Diagnostics on Real Equipment
A centrifugal compressor is one of the clearest examples of how predictive maintenance for industrial equipment should work. The asset rarely gives a single clean warning. The useful diagnosis comes from signal convergence.
A compressor example that planners can use
A compressor train starts showing rising bearing temperature at the inboard bearing. That alone isn't enough for a work order. Process load, ambient conditions, and lubrication state all need context. Then the vibration trend moves upward in velocity RMS, and the spectrum shows a clear increase at a running-speed-related component along with bearing defect energy. At the same time, oil analysis reports increased wear debris.
Now the plant has a coherent diagnosis. The analyst reviews the waveform, spectrum, and oil result, then creates a maintenance recommendation that names the likely failure mode and the inspection urgency. The planner doesn't need a raw plot. The planner needs a work package.
A published rotating machinery study notes that a machine is considered in good condition when RMS vibration velocity is below 0.720 mm/s under ISO 10816, as described in this rotating machinery vibration study. That type of acceptance limit is useful in early screening, but real work-order decisions still need asset context, trend direction, and supporting evidence.
What the CMMS entry should contain
A useful condition-based ticket includes:
- Asset and location: Exact machine tag, train position, and bearing location
- Observed condition: Trend increase, spectral change, oil debris, temperature drift, or current anomaly
- Probable failure mode: Bearing wear, imbalance, cavitation, rotor defect, gear wear, or lubrication breakdown
- Recommended action: Inspect, align, relubricate, borescope, sample oil again, or schedule outage repair
- Urgency rule: Immediate review, next planned stop, or monitor with shortened interval
| Asset | Primary Trigger | Secondary Signal | CMMS Action | Escalation Rule |
|---|---|---|---|---|
| Centrifugal compressor | Rising vibration trend | Oil wear debris increase | Plan inspection and bearing assessment | Escalate if threshold exceeded twice in 14 days |
| Induction motor | Current signature anomaly | Temperature rise or vibration change | Electrical test and rotor evaluation | Escalate after repeat detection in 14 days |
| Gearbox | Sideband energy around gearmesh | Oil particle increase | Schedule gearbox inspection | Escalate after repeat detection in 14 days |
| Centrifugal pump | High-frequency cavitation signature | Flow instability or vibration increase | Check suction conditions and impeller health | Escalate after repeat detection in 14 days |
| VFD-driven asset | Electrical harmonic concern | Motor heating or current distortion | Review drive condition and motor effects | Escalate after repeat detection in 14 days |
Who reviews what
The route collector shouldn't be the final authority on every diagnosis. A vibration analyst should review spectral alarms. An electrical specialist should review motor current concerns. The planner should receive a cleaned, decision-ready summary through the plant's work order management process.
A PdM alert becomes valuable only when someone can schedule the right job before the defect becomes a shutdown.
KPIs and ROI Calculations That Hold Up to Scrutiny
A plant manager asks the same question every time a PdM program wants more budget. What did we prevent, what did it save, and can finance verify it? If your answer depends on a screenshot from a dashboard, your case is weak.
Track a short KPI set. Tie every alert to a business outcome. Start with a locked baseline before the first route is run or the first continuous tag goes live. That discipline matters more than adding another chart.
The KPI set worth defending
Use four measures and use them consistently:
- Unplanned downtime hours on monitored assets
- Maintenance cost per unit produced
- Mean time between failures on monitored assets versus a comparable control group
- OEE availability, where OEE means Overall Equipment Effectiveness and availability reflects uptime against planned production time
Do not mix pilot assets with the whole plant. Do not change the asset list halfway through the measurement period. Do not compare a high-volume quarter to a low-volume quarter and call it improvement. If production mix shifted, note it. If operating duty changed, adjust for it. If you cannot hold the baseline steady, your ROI number will not survive review.
What the external evidence supports
External benchmarks help frame expectations, not prove your plant's savings. One industry summary cites U.S. Department of Energy findings that condition-based monitoring programs can return 10x investment, while cutting breakdowns by 70 to 75% and downtime by 35 to 45%, according to this condition-based monitoring ROI summary.
A separate manufacturer-focused summary reports that 95% of organizations implementing predictive maintenance achieved positive ROI, and 27% reached full payback within 12 months, based on a cited 2023 industry survey in this predictive maintenance ROI overview.
Use those numbers as directional support only. The case has to come from your operating model. Route-based monitoring should show prevented failures on the assets you inspect at set intervals. Continuous monitoring should show faster detection on the assets where failure develops between routes. If you cannot connect the monitoring method, the diagnostic review, and the resulting work order to a prevented business loss, you do not have defendable ROI.
| Line Item | Value | Source | Notes |
|---|---|---|---|
| Avoided downtime cost | Site-specific | Internal plant baseline | Count only avoided unplanned events on selected assets |
| Reactive labor reduction | Site-specific | Internal labor records | Include overtime and callout reduction where documented |
| Program cost | Site-specific | Internal budget | Include sensors, software, analyst time, and training |
| Spare parts loss avoided | Site-specific | Internal maintenance and stores records | Count expedited freight, scrapped components, and secondary damage only when documented |
| Schedule stability gain | Site-specific | Internal production records | Use only if the plant tracks schedule disruption cost with evidence |
The formula that doesn't invite gaming
Use a plain formula. Avoided downtime cost plus reduced reactive labor, divided by total program cost.
Total program cost means all of it. Sensors. Software. Services. Analyst review time. Training. Setup effort. Time spent by planners and supervisors handling alerts. Plants often hide those labor costs because they sit in existing headcount. Finance will put them back in.
Three habits ruin credibility fast:
- Counting planned outages as avoided downtime
- Inflating hourly downtime value without production evidence
- Excluding analyst time, triage time, or false-alert review effort
One more recommendation. Report gross savings and net savings separately. Gross savings shows what failures you prevented. Net savings shows whether the PdM operating model is efficient enough to scale. That split exposes a common problem early. A plant can detect real defects and still waste money if alert review, work order screening, and follow-up inspection are poorly governed.
That is why ROI in PdM is not a sensor question. It is an execution question. If the plant chooses the right assets, sets the right review rules, and measures only verified outcomes, the numbers hold up. If it floods the system with low-value alerts and vague savings claims, the program will lose support even when the technology is working.
Pitfalls That Derail Predictive Maintenance Programs
Most PdM failures are management failures wearing technical clothing. The sensors usually work. The program doesn't.
Alert fatigue destroys trust first
This is the fastest way to kill a rollout. The plant enables too many thresholds, pushes every deviation into the same queue, and trains planners to ignore the dashboard. Once the team sees enough false alarms, the one real bearing defect gets treated like another nuisance.
The trust problem is not theoretical. Recent case evidence shows how ugly false positives can get. One industrial case produced roughly 1 true positive to 12 false positives, and another wire-drawing maintenance model reported 6,980 false positives before decision-layer tuning reduced false alarms while preserving recall, as discussed in this predictive maintenance case study on false alarms and tuning. Plants that obsess over model accuracy and ignore alarm governance end up training their own people not to believe the system.
The fix is operational, not cosmetic.
| Pitfall | Symptom in the Plant | Prescriptive Fix |
|---|---|---|
| Alert fatigue | Analysts mute dashboards, planners ignore alarms, urgent defects get buried | Use tiered alarms tied to asset criticality, review false positives weekly, and suppress duplicate alarms |
| Data governance gaps | Measurement points drift, historians become unusable, condition data sits outside maintenance workflow | Lock naming standards early, assign one data owner, and connect findings to asset records and work orders |
| Vendor lock-in | Trend history becomes trapped in proprietary formats, migration becomes painful | Require open data exports, documented interfaces, and exit terms before scale-up |
| Pilot sprawl | Too many asset classes, inconsistent review methods, no clear learning loop | Limit the pilot to one or two asset classes and retire weak scope quickly |
The adoption gap is wider than most leaders admit
Many plants say they want AI-enabled maintenance. Far fewer can deploy it at plant level. A 2026 maintenance-trends summary reports that 65% of maintenance teams plan to adopt AI by year-end but only 32% have fully or partially implemented it, according to this maintenance trends and implementation summary. That gap doesn't exist because the concepts are too advanced. It exists because plants underestimate data quality, workflow design, and skills requirements.
A multi-site manufacturer often proves this point. Corporate approves a PdM initiative. One site collects good route data. Another installs always-on sensors. A third site never links alerts to the CMMS. Twelve months later, leadership has three incompatible workflows and no clean basis for comparison.
Data discipline beats enthusiasm
The plant needs one taxonomy for assets, points, and fault codes. It needs one owner for data quality. It needs one rule for where condition findings live. If analysts keep notes in one system, planners build work in another, and operators track observations in a third, reliability gets fragmented.
One practical option is to use an external reliability partner when the site lacks specialist coverage across vibration, oil, ultrasound, thermography, and motor current review. Forge Reliability provides predictive maintenance, condition monitoring, and reliability consulting programs that connect those diagnostics to asset criticality, maintenance workflows, and planning decisions.
Plants don't usually fail at prediction. They fail at prioritization, workflow integration, and ownership.
A planning-meeting checklist that exposes weak programs
Before expanding any predictive maintenance program, the plant should answer these questions clearly:
- Criticality defined: Is there an asset criticality ranking tied to safety, environmental, and production consequences
- Monitoring method chosen: Has each asset class been assigned route-based, continuous, or no PdM coverage based on fault progression and accessibility
- Workflow connected: Can the CMMS receive condition-based work orders with trend attachments and clear urgency codes
- Data ownership assigned: Is one named role accountable for point structure, alarm logic, and condition-data quality
- Pilot scope controlled: Is the current rollout limited enough for the team to review alerts properly and learn from execution feedback
- Scale-up gated: Will expansion depend on KPI evidence instead of internal enthusiasm or vendor pressure
Leaders should treat those as design constraints. Not cleanup work for later.
If the plant cannot answer those questions cleanly, it isn't ready to scale. It needs to tighten the operating model before buying more hardware. The next compressor trip, gearbox failure, or motor bearing defect won't wait for the next budget cycle.
A free reliability assessment can show exactly where a plant's predictive maintenance program is overbuilt, under-governed, or missing the right diagnostic coverage. Forge Reliability helps manufacturers and industrial facilities connect PdM strategy to real asset criticality, route design, continuous monitoring, and work-order execution. To pressure-test the current program against the operating model in this guide, visit Forge Reliability.