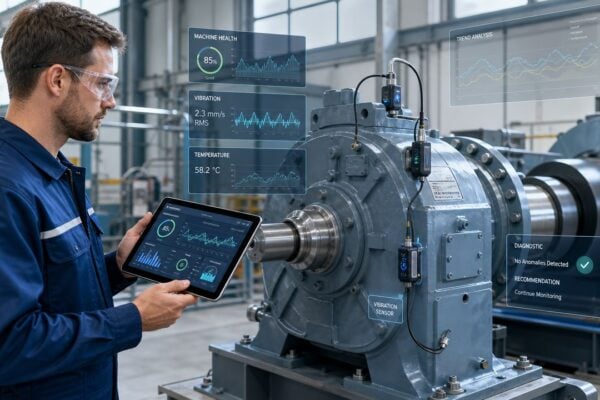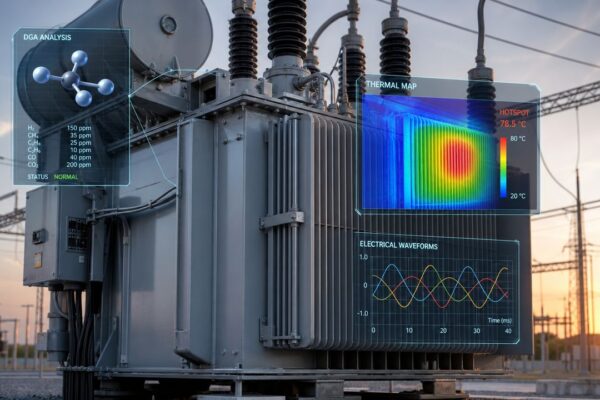
A production line keeps tripping on the same asset. The maintenance team has already changed seals, aligned the coupling, and replaced the motor once. Operations wants a permanent fix. Finance wants to know whether the answer is a spare pump, a second train, better monitoring, or tighter maintenance execution.
That's where most plants either get disciplined or get expensive.
Reliability block diagrams give plant teams a way to map how equipment failure turns into system failure. Instead of arguing from instinct, they model the success path of the system, then use that logic to test decisions before money is committed. For reliability engineers, maintenance managers, and operations leaders, that changes the conversation from “what feels safer” to “what most improves uptime under the current operating assumptions.”
Table of Contents
- Beyond Guesswork Why Your Plant Needs Reliability Block Diagrams
- The Core Concepts Series Parallel and the Math of Uptime
- Modeling Real-World Plant Systems
- Translating RBDs into Maintenance Decisions
- Integrating RBDs with FMEA RCM and Fault Tree Analysis
- Validating Your Model with Predictive Maintenance Data
- Build a More Reliable Plant Starting Today
Beyond Guesswork Why Your Plant Needs Reliability Block Diagrams
A plant manager dealing with a repeat cooling water pump failure usually faces three competing answers. Replace the existing unit with a heavier design. Add a backup pump. Tighten inspection, lubrication, alignment, and operating discipline. All three can sound reasonable, and all three can waste money if the actual system constraint sits somewhere else.
A reliability block diagram solves that by forcing the team to define what has to work for the process to succeed. It is a logical success-path model that defines which functions must operate for a system to meet its purpose, and it's used to compare the reliability impact of adding a redundant pump or bypass line before capital is committed, turning component data into a system-level performance estimate, as described in this reliability block diagram reference.
That distinction matters on the plant floor. A pump may look critical because everyone notices it. But if the system can survive a pump trip through a bypass line or standby train, the true risk may be the shared suction header, a control valve, or the transfer logic that fails when the standby should start.
Why plants get stuck without them
Most recurring downtime problems don't come from lack of effort. They come from treating component reliability and system reliability as if they were the same thing.
A maintenance team can improve one asset and still leave the system exposed because:
- The wrong block got attention. A highly visible machine isn't always the system bottleneck.
- A shared dependency was ignored. Redundant equipment still fails together if both depend on the same utility, exchanger, or control signal.
- The decision was framed too narrowly. Teams choose between repair and replacement when the better answer is changing system architecture or maintenance strategy.
Practical rule: If a plant can't clearly describe the success path for a critical system, it can't reliably justify capital or maintenance spending on that system.
For operations leaders, reliability block diagrams shift from being an engineering exercise to serving as a planning tool. They support maintenance prioritization, resource allocation, and operating decisions that fit the actual process logic.
Plants already working on operations and maintenance improvement programs usually find that an RBD exposes gaps between how the process is supposed to run and how it survives failures during normal production.
The Core Concepts Series Parallel and the Math of Uptime
What an RBD actually models
At the simplest level, a reliability block diagram asks one question. What has to stay successful for the system to complete its function?
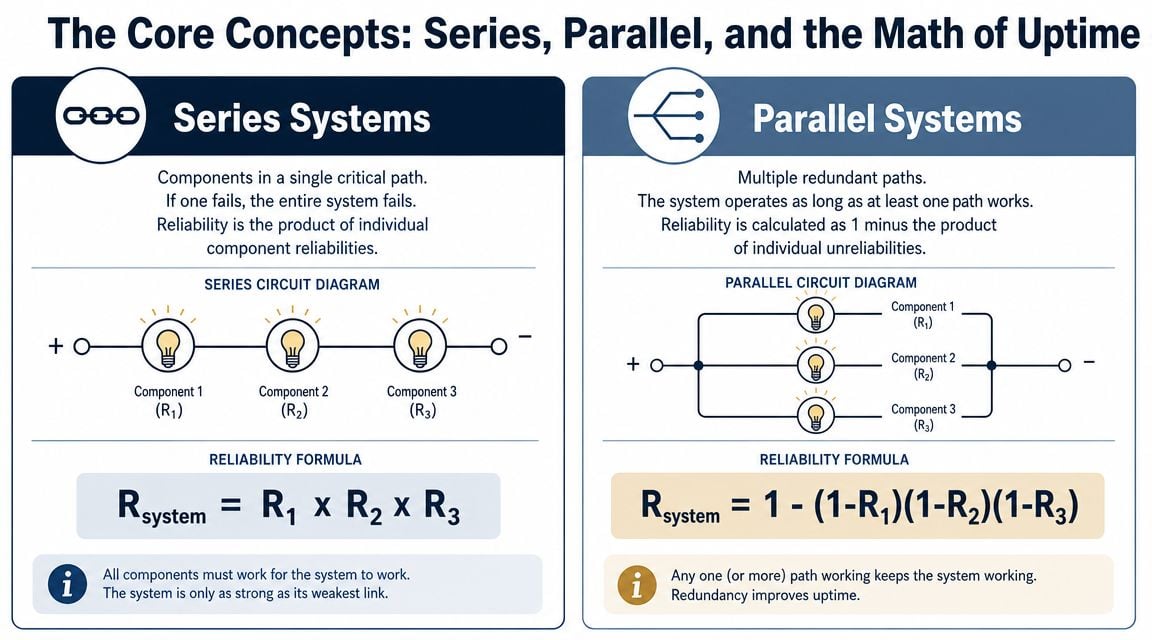
In a series configuration, every block in the path must work. If one fails, the system fails. In a parallel configuration, more than one path can satisfy the function, so the system survives as long as at least one valid path remains.
This visual comparison is useful when teaching teams how system logic changes uptime.
A simple plant example
Consider a food and beverage conveyor train made up of a motor, gearbox, and belt. If the line can't run when any one of those fails, that train is a series system. The system reliability is the product of the individual block reliabilities.
A commonly cited example shows three series components with reliabilities of 0.8, 0.9, and 0.9, producing an overall system reliability of 0.648, or 64.8%, and it also shows that the reliability of a series system is always lower than its least reliable element, as explained in this engineering discussion of RBD importance.
That's the point many teams miss. Improving one already-strong block often won't move system performance much if the weak block remains untouched.
| Configuration | Diagram Logic | Reliability Calculation | System Reliability |
|---|---|---|---|
| Series | All blocks must succeed in one path | Multiply block reliabilities | Lower than the least reliable block in the path |
| Parallel | At least one path must succeed | Calculate from the complement of all paths failing | Higher than a single-path arrangement when redundancy is real |
A packaging area provides the opposite case. If two parallel machines can each carry the load and only one must run to keep shipments moving, the system logic is parallel. In that setup, the question isn't just “how reliable is each machine?” It's “how often are both unavailable at the same time?”
What the math means for maintenance
Through the diagram, reliability engineers can connect it to action:
- Series blocks highlight single points of failure. Those are often the best targets for redesign, spares strategy, or condition monitoring.
- Parallel blocks test whether redundancy is genuine. Two pumps aren't true redundancy if they share a bad suction condition or common control failure.
- The diagram improves planning discipline. It pushes teams to use measured failure data, engineering estimates, or MTBF-based assumptions with more structure than gut feel.
Teams that need cleaner failure interval data often start by improving how they calculate mean time between failure for the exact function being modeled, not just for a broad equipment class.
A clean RBD doesn't make the plant simpler. It makes the failure logic visible.
Modeling Real-World Plant Systems
Where basic diagrams break down
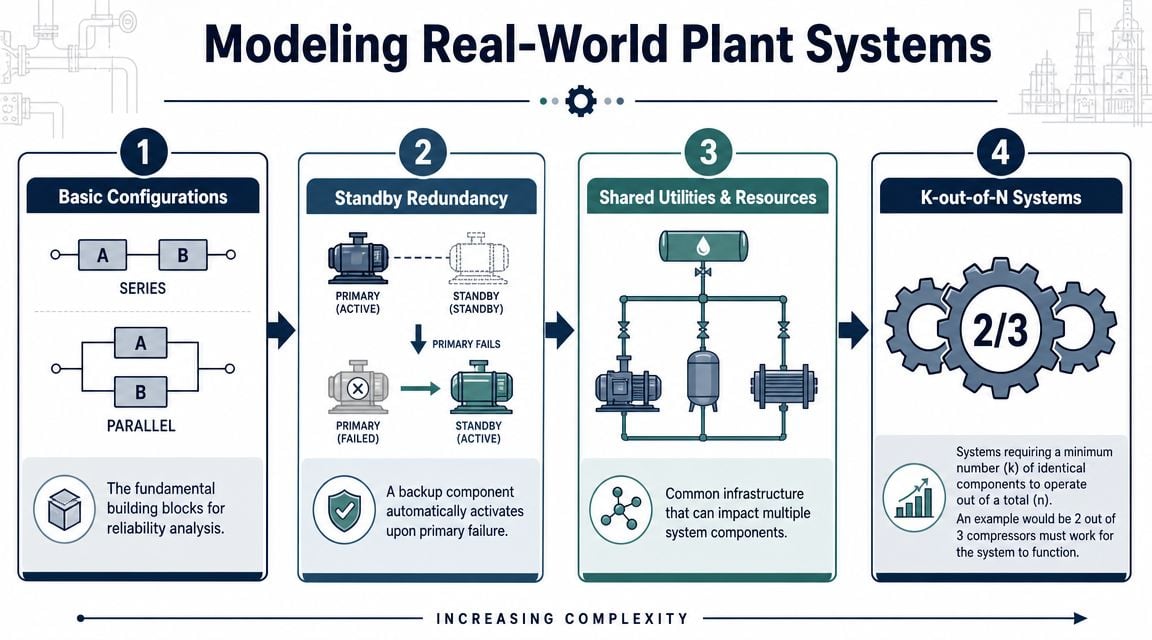
Most plants don't operate as neat textbook series or parallel arrangements. They run with standby pumps, shared utilities, permissive logic, repairable assets, and production constraints that change by mode. A reactor cooling loop in a chemical plant is a good example. The process may have a primary pump, a cold standby pump, a shared heat exchanger, bypass valves, and an automatic transfer sequence.
That system can't be modeled well by drawing two pumps in parallel and stopping there.
Advanced reliability block diagrams can model dependencies and even repeated use of the same item in different logical roles. That matters because if a shared cause or dependent mode is modeled correctly, the calculated system reliability can change materially, which can also change which asset or failure mode is the true risk driver, as shown in this technical discussion of advanced RBD logic.
This visual progression helps when teams need to move from basic logic to actual plant architecture.
A cooling system example
Take a reactor cooling system with these conditions:
- Primary circulation pump online
- Standby pump available on demand
- One shared heat exchanger required for either path
- Bypass valve that must open in a specific upset condition
- Repair activity that can restore failed equipment during the operating horizon
The right RBD has to reflect operating reality, not nameplate redundancy. If the standby pump can only save the process when the exchanger is healthy and the changeover logic works, those dependencies belong in the model. If the same control component supports multiple functions, it shouldn't be hidden as an afterthought.
How to make the model usable
A practical plant model usually works best when built hierarchically. A team can represent the entire cooling loop as one subsystem inside a larger site-wide model for reactor availability, utility support, or production continuity.
That approach is useful when a facility wants to compare line-level interventions with broader plant changes such as debottlenecking utilities or revising spare philosophy through plant optimization services.
For complex systems that evolve over time, engineers also benefit from broader thinking around simulation and IoT for risk mitigation, especially when equipment state, repair response, and operating modes don't stay fixed.
The best RBDs don't mirror the P&ID. They mirror the logic of survival.
When the model is built that way, the plant gets answers that matter. Which failure disables both trains. Which standby unit is only redundant on paper. Which shared utility deserves more attention than the rotating equipment everyone talks about.
Translating RBDs into Maintenance Decisions
An RBD earns its keep when it changes what the plant does next. A mine ventilation system is a strong example because the consequences of fan unavailability are operationally severe, and teams often debate the same three responses. Install another fan. Hold spare motors and drives onsite. Add better sensing so faults are found before forced outages.

The diagram doesn't make that decision automatically. It does something more useful. It shows which block or dependency has the largest effect on system success under the plant's actual operating assumptions.
Where to spend first
A common mistake is treating all reliability improvements as interchangeable. They aren't.
If the RBD shows the system is dominated by a single motor-driven fan with no valid alternate path, then a spare bearing kit won't provide the same risk reduction as reducing the chance of complete train loss. If the model shows the fan is repairable quickly but the variable frequency drive has long replacement lead time, then stocking the drive may matter more than changing preventive maintenance frequency on the fan bearings.
A disciplined review usually weighs three levers:
- Reduce failure likelihood. This includes alignment correction, lubrication control, contamination control, load management, and operating discipline.
- Reduce outage duration. This includes onsite spares, prebuilt assemblies, documented job plans, and technician readiness.
- Change the system logic. This includes true redundancy, bypass capability, or redesign to remove a shared single point of failure.
Three decisions an RBD sharpens
Sensor placement
Condition monitoring works best where a failure mode threatens a critical block and where detection can trigger timely action. On a ventilation fan, that may mean placing vibration monitoring on bearings and motor support points, or electrical monitoring on the drive path, not just adding sensors everywhere. The RBD helps justify why one location matters more than another.
Spare parts strategy
Plants often stock spares based on past pain rather than system effect. The diagram helps separate “expensive and annoying” parts from “parts that control process survival.” A spare pump that can't run without a common suction valve or shared controls may rank lower than expected.
Redundancy investment
A second unit is only worth the capital if it creates a real alternate success path. If both units fail from the same utility upset, same suction condition, or same permissive logic, the plant bought complexity without much resilience.
Decision filter: If a proposed improvement doesn't change a critical success path, it probably won't change plant performance enough to justify the spend.
At this juncture, maintenance leaders can translate reliability work into budget language. The question stops being “what maintenance should be added?” and becomes “which intervention most improves system success, fastest recovery, or both?”
Integrating RBDs with FMEA RCM and Fault Tree Analysis
How the methods support each other
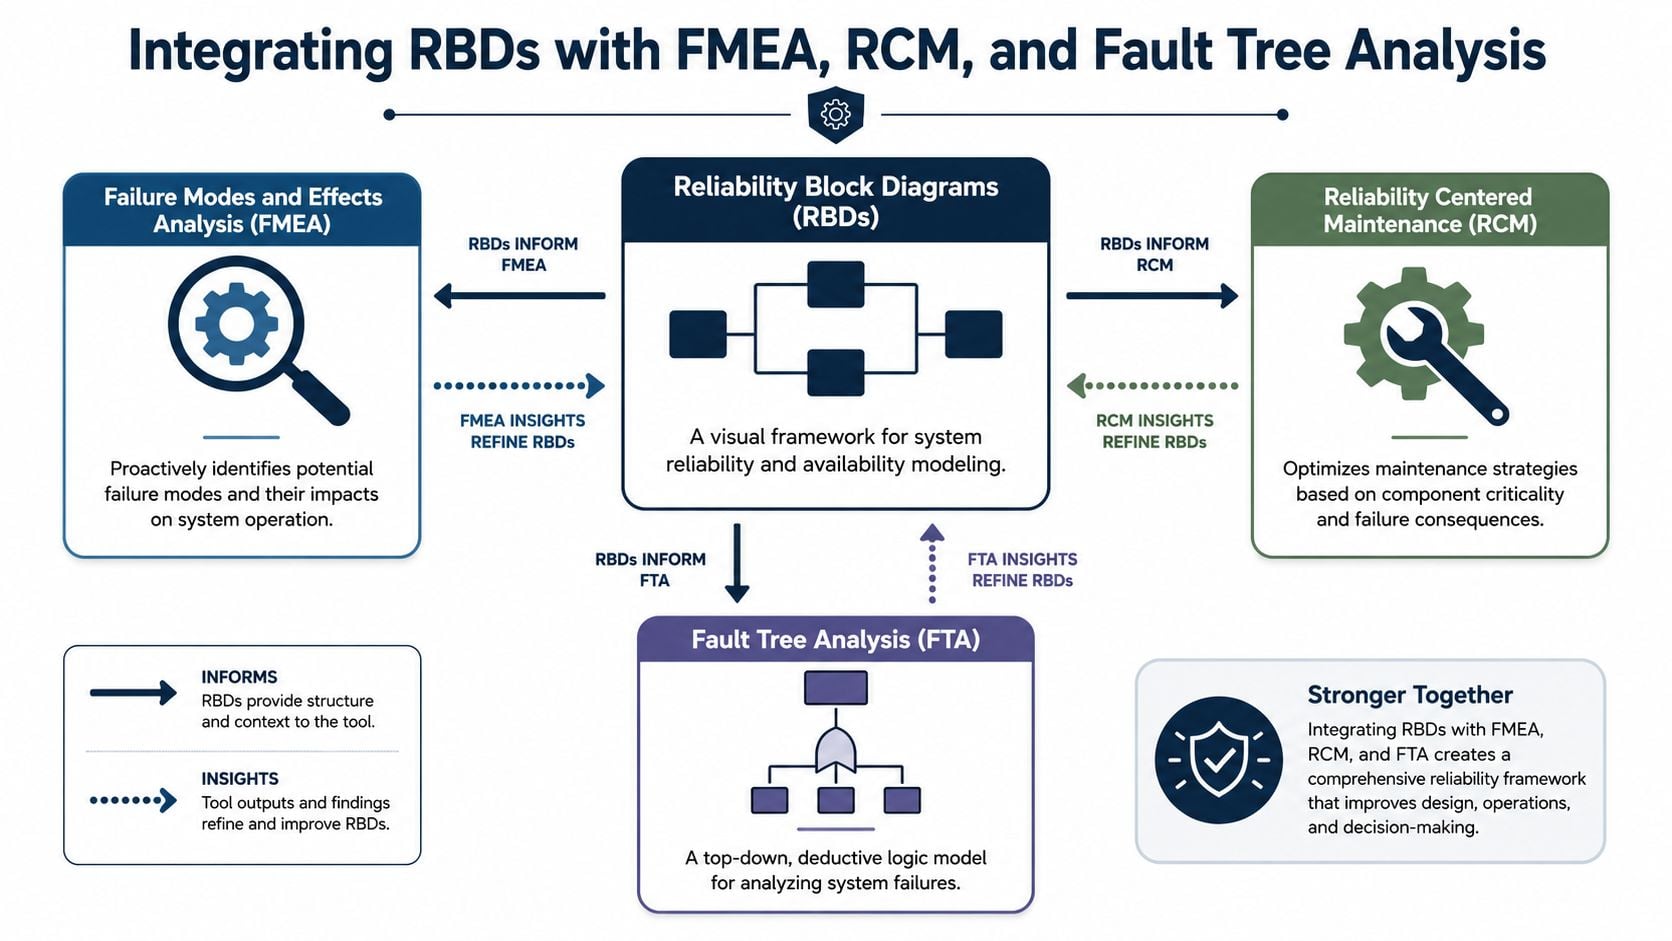
Reliability block diagrams are strongest when they sit inside a broader reliability program instead of living as a one-off model. In a power generation setting, a steam turbine support system may already have failure modes documented for lube oil pumps, control valves, cooling auxiliaries, and instrumentation. Those failure modes provide input to the RBD. The RBD then shows which of those failures threaten the turbine's required operating function.
That feedback loop matters because these methods answer different questions.
- FMEA identifies how a component can fail and what the local or downstream effect may be.
- RCM uses consequences and functional importance to choose the right maintenance task or default action.
- RBD shows how those component behaviors combine into system-level success or loss of function.
This integration graphic is useful for explaining the relationship across methods.
A maintenance team refining failure logic and maintenance consequences can support that work with a stronger FMEA process for maintenance planning.
When to use fault logic instead
RBDs are success-oriented. They model the combinations of functions that must remain available. Fault tree analysis works from the opposite direction. It starts with an unwanted top event and traces combinations of causes that can produce it.
Both are valuable, but they serve different plant questions. If the issue is “what architecture gives this process the best chance of staying online,” an RBD is often the cleaner starting point. If the issue is “how could this dangerous or costly system failure happen,” fault logic is often sharper.
Modern RBD work also extends beyond static diagrams. It can model repairable configurations through Monte Carlo simulation by alternating failure and repair times over many iterations, allowing the method to use measured failure distributions, MTBF estimates, or qualitative assumptions that are refined as asset data improves, as outlined in this review of RBD mathematical foundations.
A plant doesn't need one reliability method. It needs each method doing the job it fits best.
When these tools are connected, maintenance strategy becomes more consistent. Failure modes feed the model. The model identifies true system drivers. RCM then assigns tasks where they matter most.
Validating Your Model with Predictive Maintenance Data
The model is only as good as the assumptions
An RBD is a decision tool, not a decorative drawing. If the assumed failure behavior is wrong, the ranking of critical blocks can be wrong too. That's why model validation matters so much in operating plants.
A key issue for plant teams is how to validate RBD assumptions against CMMS and condition-monitoring data. The main output of an RBD is projected performance under specific assumptions, so the model must be updated as field data, testing results, and engineering estimates improve if it's going to remain a valid decision tool, according to this overview of RBD value and model updating.
For a wastewater pumping station, for example, a first-pass model may show one pump train as the weak block. After a review of work orders and alarm history, the actual issue may turn out to be nuisance trips from controls, chronic suction conditions, or poor standby readiness after maintenance.
What to check against plant data
The strongest validation loop pulls from both historical records and current asset condition.
- CMMS work orders help confirm what failed, how often the function was lost, and how long restoration took.
- Condition monitoring helps distinguish assets that are statistically weak from assets that are deteriorating right now.
- Operator logs and shift notes often reveal demand-related failures, startup issues, and transfer problems that don't appear clearly in coded maintenance data.
A practical review often includes vibration on pumps and motors, thermal imaging on electrical connections and switchgear, oil analysis on gearboxes and hydraulic systems, and checks on standby equipment that rarely carries load until an upset occurs.
Keep the model alive
The most useful RBDs are revised when plant learning changes the assumptions. A pump that looked problematic last year may not deserve the same attention after alignment, base correction, and lubrication control have stabilized it. Another asset may move up the ranking when predictive indicators show deterioration or when repairs repeatedly take longer than planned.
Plants building a stronger digital validation loop often tie model updates to their broader predictive maintenance and machine learning efforts, especially when condition data can show whether a high-risk block is degrading or overrepresented in old failure history.
If the plant updates vibration routes, PM intervals, and spare parts settings but never updates the RBD, the model stops reflecting reality.
That's why ownership matters. Someone has to review assumptions, compare them with field evidence, and revise the logic when the system or maintenance response changes.
Build a More Reliable Plant Starting Today
Plants don't struggle with reliability block diagrams because the concept is too complicated. They struggle because the plant rarely has time to stop and define the system logic clearly enough to make better decisions. Once that logic is visible, the usual debates get sharper fast.
A good RBD shows whether the plant has a real single point of failure, fake redundancy, or a maintenance problem disguised as a capital problem. It helps reliability engineers decide where monitoring belongs. It helps maintenance managers decide which spare matters. It helps operations leaders decide whether a second train, bypass path, or repairability improvement is worth the cost.
The practical payoff is discipline. Instead of reacting to the loudest failure, the team can focus on the block, dependency, or repair constraint that most affects production continuity.
That's the point. Reliability block diagrams turn uptime decisions into system decisions.
The next major maintenance or capital decision shouldn't rely on intuition alone. A structured model built around real failure behavior, repair reality, and process logic gives the plant a far better basis for action.
A free reliability assessment from Forge Reliability can help identify critical assets, expose hidden single points of failure, and determine where reliability block diagrams, predictive maintenance, and maintenance strategy changes will have the biggest impact on uptime.