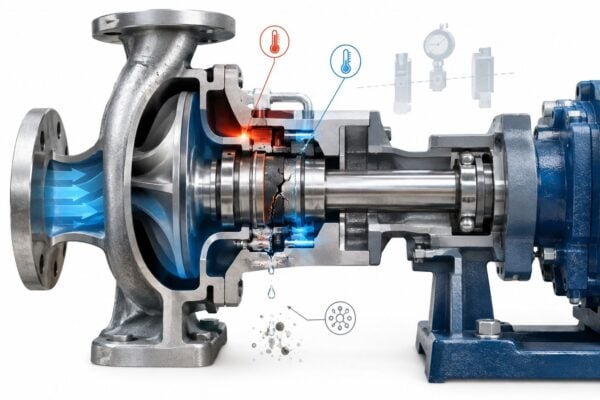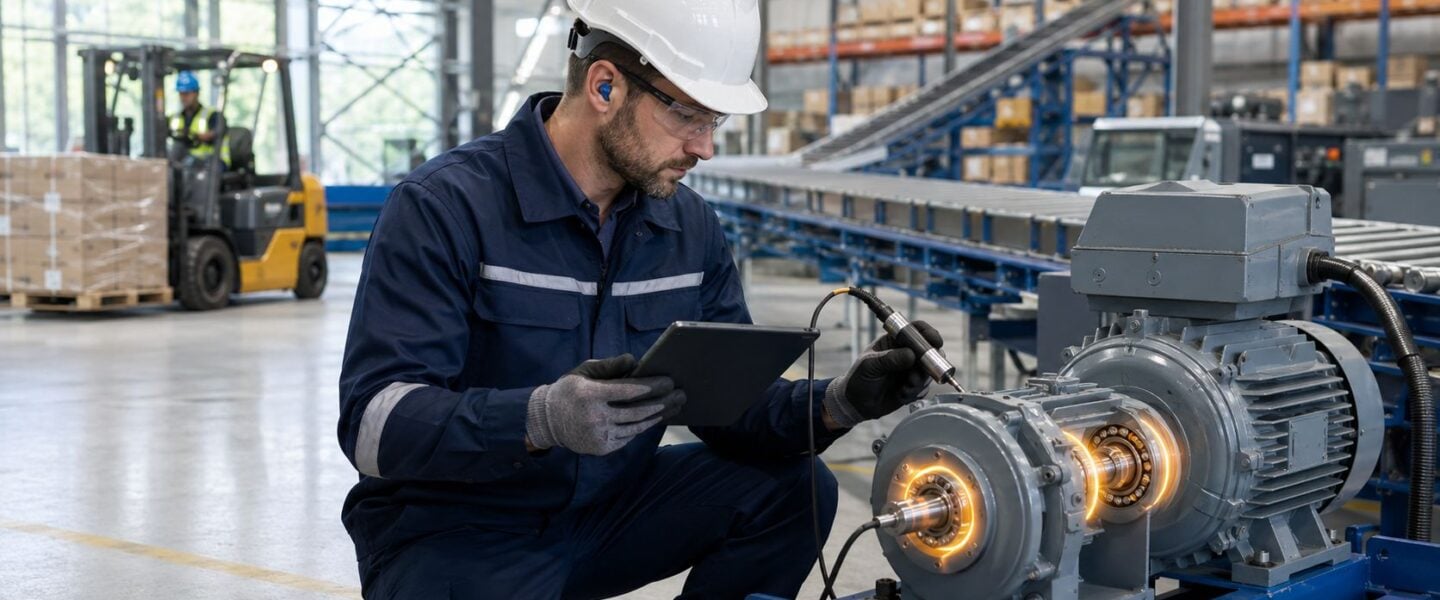
A distribution center can lose half a shift to one failed conveyor motor. The first alarm usually isn't the problem. The problem lies in the queue that forms upstream, the labor that gets redeployed into manual handling, the trailer schedule that slips, and the customer orders that leave late because one rotating component stopped doing a simple job.
That's why logistics equipment reliability can't be managed as a collection of isolated repairs. Conveyors, sorters, palletizers, dock equipment, lift systems, and forklift charging infrastructure operate as a chain. When one link weakens, the plant doesn't just absorb a maintenance event. It absorbs a throughput event.
The scale of the exposure is easy to underestimate. The global material handling equipment market was valued at USD 189.6 billion in 2025 and is projected to reach USD 372.6 billion by 2035. That growth reflects how much capital operators are putting into systems that must move product continuously, safely, and predictably.
Table of Contents
- The True Cost of Logistics Equipment Downtime
- First Things First Prioritizing Your Assets
- Decoding Common Logistics Equipment Failures
- Choosing the Right Diagnostic and Monitoring Tools
- From Reactive Repairs to Predictive Reliability
- Implementing a Data-Driven Reliability Program
- Take Control of Your Logistics Equipment Reliability
The True Cost of Logistics Equipment Downtime
A conveyor rarely fails all at once. The operation gets warnings first. A bearing starts to run hot on an induction motor. A photoeye bracket loosens just enough to cause intermittent misses on dark cartons. A pneumatic divert begins to hesitate under peak parcel flow, then clears on the next cycle and gets ignored. By the time the line stops, maintenance is no longer fixing one component. The team is recovering a disrupted system.
That distinction matters on the plant floor.
In logistics equipment, downtime cost comes from lost function, backed-up flow, and the chain of secondary effects that follow. One failed drive at a merge can starve a sorter, overload upstream accumulation, push operators into manual handling, and turn a controlled process into congestion. Restart adds its own risk because belts, couplings, reducers, and controls are all asked to recover at the same time, often with product still sitting in the wrong places.
Plant managers often look first at the failed part because it is easy to see and easy to price. Reliability work starts with a harder question. What function did that part support, and what happened to the rest of the system when that function was lost?
A low-cost motor on a non-critical takeaway conveyor may wait until the next planned stop. The same motor on a feed conveyor to the main sortation line can become the site constraint for an entire shift. FMEA and criticality ranking both depend on that difference. Severity in a logistics environment is tied less to replacement cost and more to flow interruption, safety exposure, recovery time, and the chance that one failure will trigger several more.
Firefighting looks manageable until volume rises. Then the pattern gets expensive fast. Technicians spend the shift chasing repeat stoppages, planners lose the chance to stage parts and labor, operators work around equipment that should be stable, and overtime becomes the hidden tax on reactive maintenance.
The warning signs are usually specific:
- Sorter line 3 throws the same divert jam during the morning parcel surge, but runs acceptably at lower volume.
- Zone 14 on the accumulation conveyor faults after every washdown because moisture is getting into one sensor connection.
- A stretch wrapper gearbox runs louder each week, yet no work order is opened until the wrapper trips and shipping starts stacking pallets on the dock.
- Manual recovery becomes the standard response for one troublesome transfer point, which increases forklift traffic and near-miss exposure in an area designed for automated flow.
These are not random incidents. They are failure patterns. Once a team can name the pattern, it can rank the consequence and decide whether the right response is redesign, condition monitoring, inspection, planned replacement, or a better operating practice.
Teams trying to control those losses often start with a broader maintenance cost reduction approach for industrial assets. In logistics operations, the biggest savings usually come from tying cost to failure mode instead of treating all downtime hours as equal. An hour lost to a non-critical conveyor and an hour lost to the only sorter feed line do not carry the same business consequence, and the maintenance plan should not treat them as if they do.
First Things First Prioritizing Your Assets
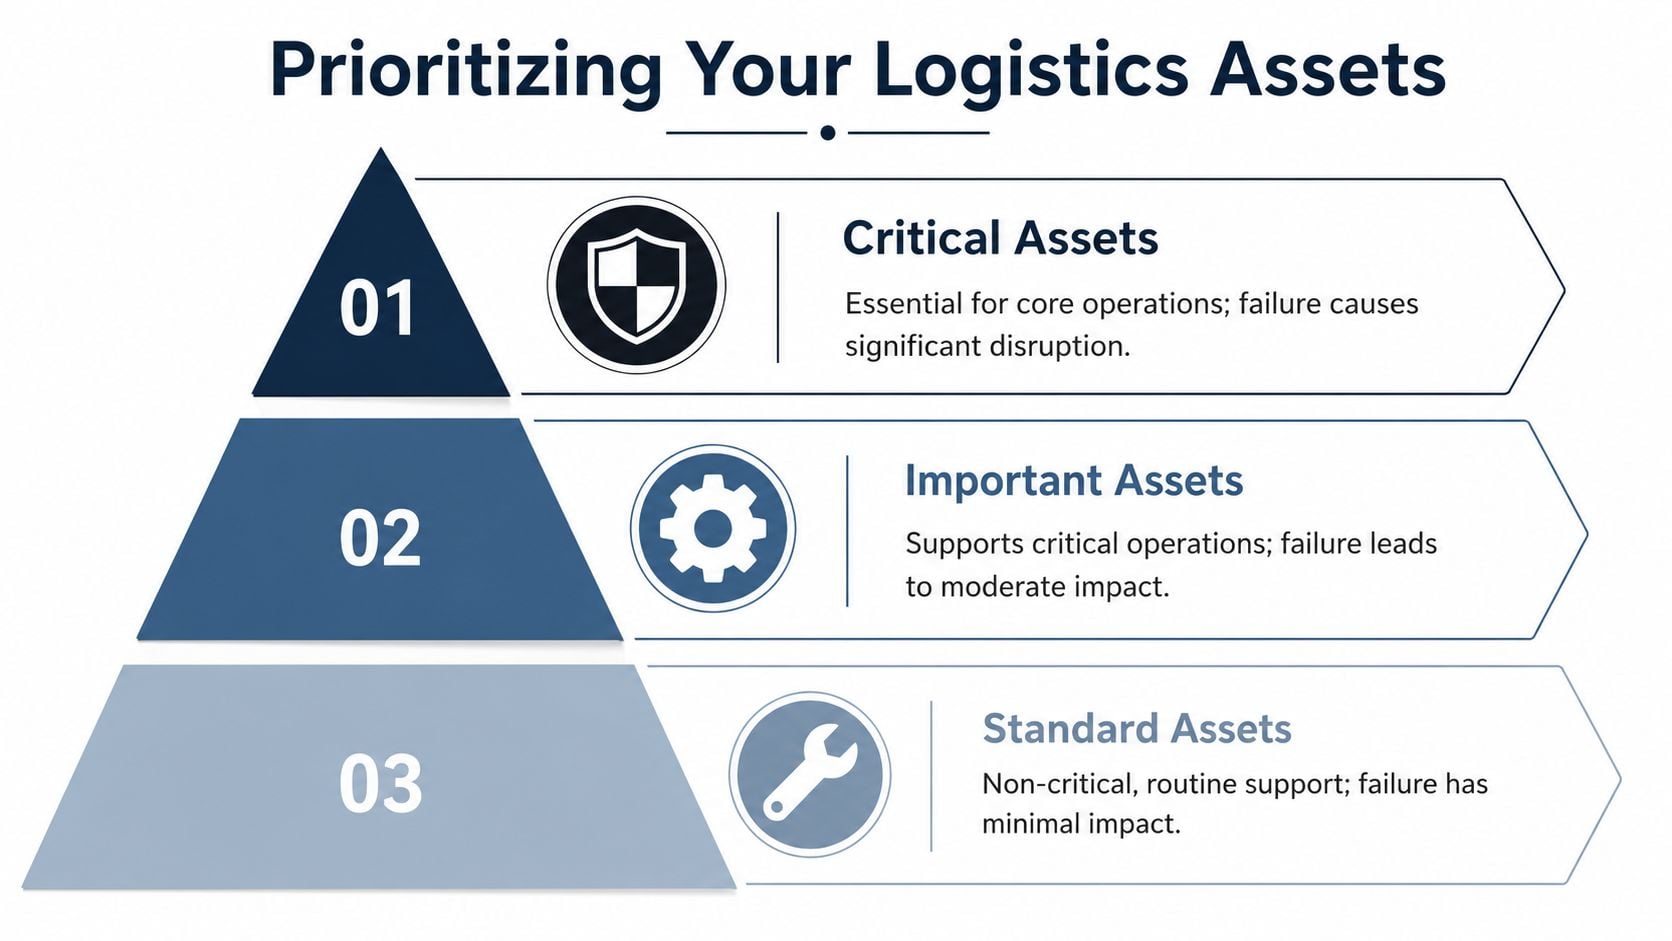
Most reliability programs stall because the asset list is too long and the team treats everything as equally important. It isn't. A main sortation line, a pallet wrapper, a dock leveler, and office HVAC don't belong in the same decision bucket.
Asset prioritization solves that by forcing the plant to answer two practical questions. What hurts the operation most when it fails, and how likely is that failure to arrive before someone catches it?
Why criticality has to come before tasks
Failure Modes and Effects Analysis, or FMEA, sounds more complicated than it is. On the plant floor, it's a structured way to rank risk. Teams score each failure mode using three factors:
- Severity: How bad is the consequence if this failure occurs?
- Occurrence: How likely is it to happen?
- Detection: How likely is the team to catch it before it causes functional loss?
For logistics equipment, those scores are easiest to understand through direct comparison. A sorter divert actuator that sticks during peak volume has high severity because it can block flow across multiple lanes. A failed light in a maintenance office may still need repair, but it won't threaten outbound throughput.
For high-consequence systems such as automated storage and retrieval systems, DFMEA treats safety and regulatory failures as the highest class of concern. In that framework, failure modes that affect safety or regulatory compliance carry severity rankings of 9 to 10, while loss of primary function such as unreachable pallets is ranked 7 to 8.
How to score logistics equipment without overcomplicating it
The core math is simple. The Risk Priority Number is calculated as RPN = SEV × OCC × DET, and maintenance teams prioritize the top 20% of RPN values, giving highest weight to severity first. That keeps attention on the failures that create the most operational pain instead of the ones people complain about most loudly.
A useful way to apply that in a distribution site is to build a short criticality matrix around function:
| Asset example | Severity thinking | Occurrence thinking | Detection thinking | Likely priority |
|---|---|---|---|---|
| Main sorter drive | Stops core flow path | Repetitive loading and long runtime increase exposure | Often detectable if condition monitoring exists | Highest |
| Merge conveyor motor | Can choke upstream accumulation | Moderate depending on duty cycle | Detectable with basic routes | High |
| Palletizer hydraulic power unit | Disrupts end-of-line stability | Depends on contamination control and maintenance discipline | Oil and temperature trends can help | Medium to high |
| Spare takeaway conveyor | Limited system consequence | Failure may still occur from wear | Usually obvious and recoverable | Lower |
| Office lighting circuit | Minimal production impact | Failure isn't rare, but effect is small | Easy to identify | Lowest |
Teams that skip criticality ranking usually overservice easy assets and underservice the ones that can actually stop the plant.
Once priorities are set, planning gets easier. Routes, inspections, spare parts, and PM labor can be matched to risk instead of tradition. That's also where broader asset lifecycle management for industrial operations starts to matter, because replacement timing should follow criticality and failure behavior, not calendar age alone.
Decoding Common Logistics Equipment Failures
Reliability improves when teams stop writing work orders that only say “replace failed part.” That closes the job, but it doesn't close the problem. Logistics equipment fails in patterns, and those patterns usually give warning if the plant knows what to look for.
Failure mode versus root cause
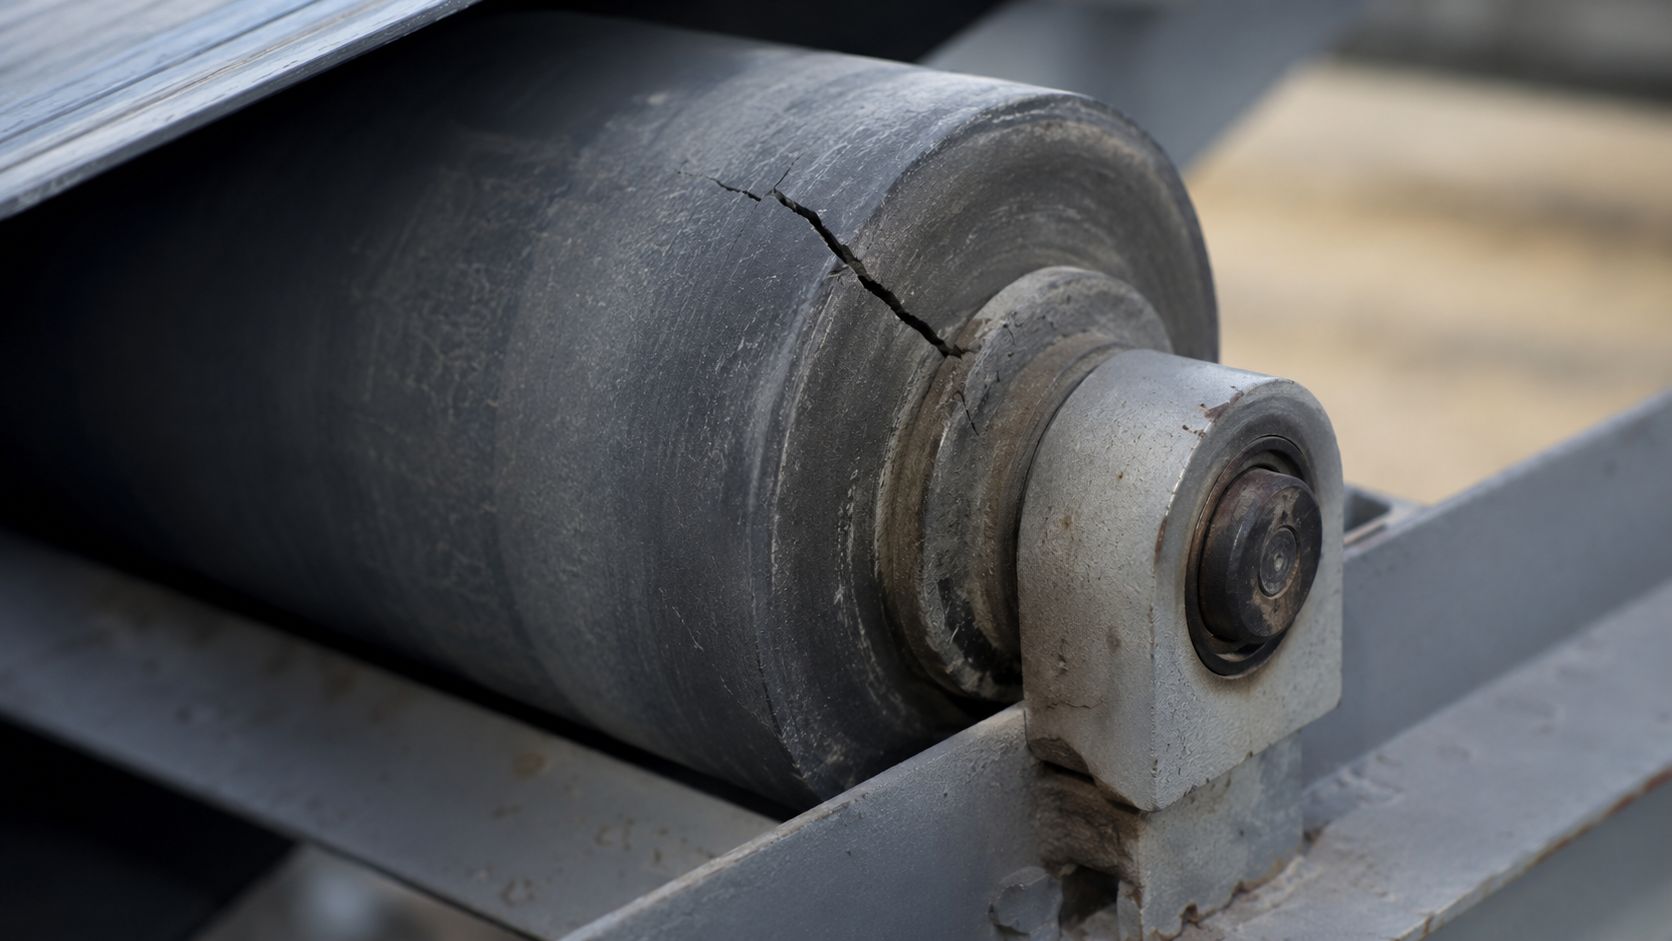
A useful maintenance taxonomy separates the physical event from the reason behind it. Effective maintenance uses a failure taxonomy such as ISO 14224 to distinguish the physical “what happened,” such as a seized bearing, from the systemic “why,” such as misalignment. That aligns with the P-F curve, where early detection of causes like lubrication defects is possible months before functional failure.
That distinction matters because technicians often fix the “what” and leave the “why” in place.
Example:
- What happened: Conveyor tail pulley bearing seized.
- Why it happened: Belt tracking drifted, side loading increased, contamination entered the housing, and lubrication intervals didn't match the environment.
If the team only replaces the bearing, the next bearing is already being damaged.
What commonly fails in a logistics operation
A practical failure review should cover each asset class by symptom, mechanism, and operational effect.
Conveyor systems: Common problems include belt mistracking, roller wear, seized bearings, coupling wear, and motor imbalance. A slipping belt can come from tension loss, lagging wear, contamination, or pulley alignment issues. Sites troubleshooting repeated tracking or traction issues often benefit from reviewing common conveyor belt slipping causes and solutions in industrial systems.
Sortation equipment: Divert switches, pop-up wheels, and transfer devices often fail through sticking, actuator wear, sensor contamination, or timing drift. These failures matter because they create intermittent loss first. That's harder to diagnose than a full stop and more damaging to quality.
Palletizers and robotic handling cells: Gripper wear, vacuum loss, hydraulic leaks, and axis drive overheating tend to develop gradually. Teams often misclassify these as control issues when the underlying cause is mechanical looseness or contamination.
Forklift charging and battery systems: Connection resistance, cable damage, battery degradation, and charger cooling issues can impact fleet availability in subtle ways. The failure may show up operationally as missed truck coverage, not as a dramatic maintenance alarm.
Dock levelers and restraints: Structural fatigue, hydraulic seal leakage, and sensor faults can move quickly from nuisance failures to safety exposure. These assets are frequently under-monitored because they're at the edge of the operation rather than inside the automated flow path.
A failure mode tells the team what broke. Root cause analysis tells the team what to change.
The P-F curve helps maintenance leaders decide when intervention is still cheap. If a conveyor bearing is already noisy to the human ear, the site is late in the curve. If ultrasound or vibration sees lubrication breakdown early, the team still has planning time. That's the difference between a scheduled bearing change on second shift and a line stop in the middle of outbound volume.
Choosing the Right Diagnostic and Monitoring Tools
Not every failure announces itself the same way. That's why plants get disappointing results when they buy one technology and expect it to solve every reliability problem. Good diagnostics start by matching the tool to the failure physics.
Match the tool to the failure pattern
For logistics equipment, the most useful predictive tools tend to line up with the P-F curve.
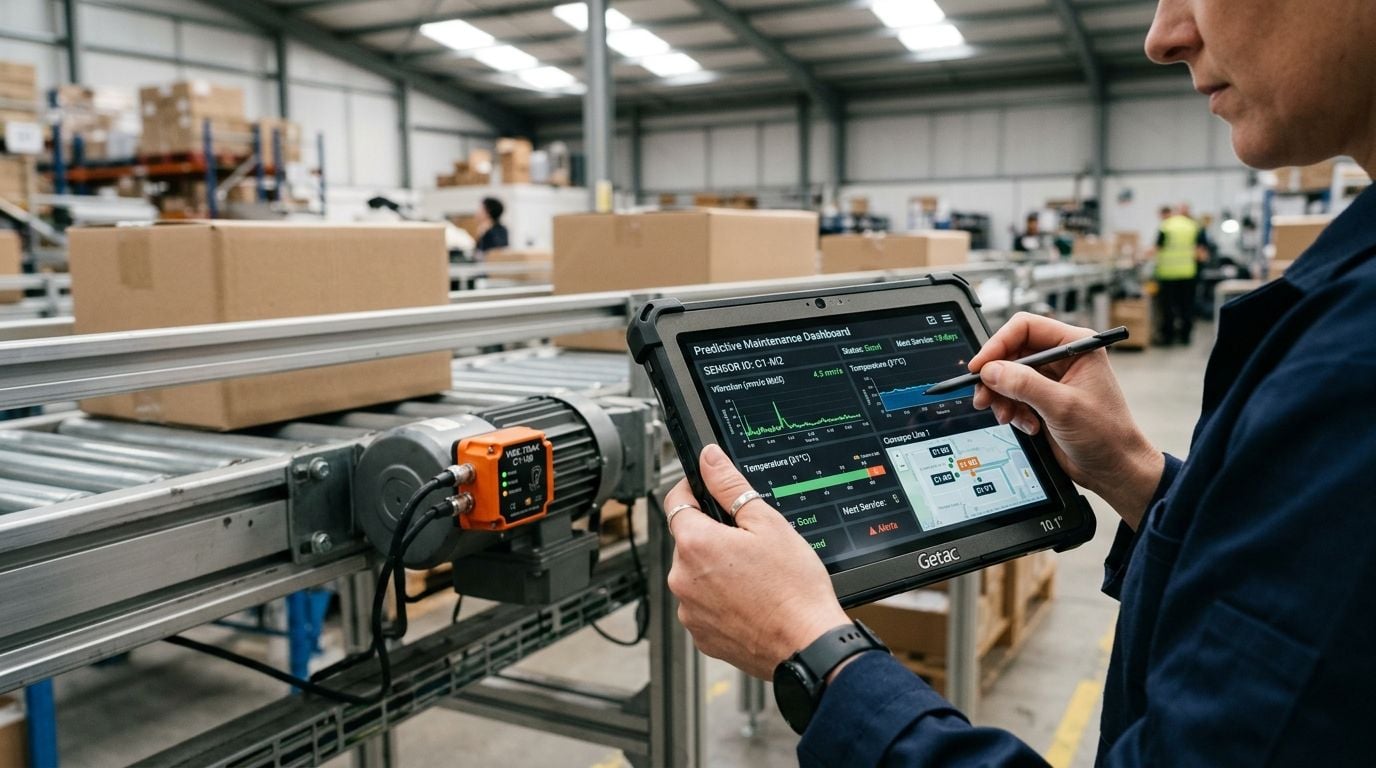
- Ultrasound: Best for very early friction and lubrication defects. On conveyor motor bearings and idlers, it can reveal distress before heat becomes obvious.
- Vibration analysis: Best for imbalance, misalignment, looseness, and bearing defect progression in motors, gearboxes, and driven rollers.
- Infrared thermography: Best for overloaded electrical connections, hot bearings, brake drag, and friction points that have already begun producing heat.
- Oil analysis: Best for hydraulic units, gear reducers, and lubrication systems where contamination and wear particles tell the story before operators feel the impact.
The practical mistake is using a late-stage tool to catch an early-stage problem. Thermography won't usually be the first indicator of a lubrication problem in a small conveyor bearing. Vibration or ultrasound will get there earlier.
Why multi-signal diagnostics matter
Complex assets rarely fail in one dimension. A gearbox problem may start as subtle vibration, show a frequency signature as wear develops, and then present transient impacts as damage advances. That's why single-signal monitoring can miss the full picture.
Research on advanced fault diagnosis shows that combining time-domain features, Fast Fourier Transform, and Wavelet Transform can achieve fault classification accuracy of 89.3%, enabling focused maintenance actions on components such as bearings or gears. In plain terms, that means the system doesn't just say “something is wrong.” It gets much closer to identifying what is wrong and where to look first.
A simple field example is a conveyor drive assembly:
| Tool | What it sees best | Example logistics equipment use |
|---|---|---|
| Ultrasound | Early lubrication distress | Motor bearings on long-run conveyors |
| Vibration | Imbalance, looseness, bearing damage | Sorter drives, pulley shafts, gear reducers |
| Thermography | Resistance heating and friction heat | MCC terminations, overloaded motors, brakes |
| Oil analysis | Contamination and internal wear | Hydraulic packs, enclosed gearboxes |
The best diagnostic program doesn't collect the most data. It collects the earliest useful data.
That's where route design matters. A low-speed roller line may justify periodic ultrasound. A mission-critical sorter drive may need continuous or frequent condition monitoring. Plants building that capability often combine route-based inspections with condition monitoring practices built for logistics and distribution assets so alarm response follows asset consequence, not convenience.
From Reactive Repairs to Predictive Reliability
Most plants don't need one maintenance strategy. They need the right mix. Treating all logistics equipment as predictive candidates wastes money. Treating all of it as run-to-failure guarantees disruption.
The decision should follow consequence, detectability, and repair economics.
Where each strategy fits
Reactive maintenance still has a place. If a short non-critical conveyor section is easy to bypass and quick to replace, running it to failure may be acceptable. The mistake is extending that logic to primary sortation drives, AS/RS lift mechanisms, dock safety systems, or palletizer hydraulic units where functional loss ripples across the site.
Preventive maintenance works best where wear-out patterns are understood and tasks are precise. Belt inspections, chain tension checks, and scheduled lubrication can all be effective. But calendar PM becomes wasteful when the interval has no relationship to actual condition.
Predictive maintenance becomes valuable when the failure mode develops gradually and the plant has enough warning to plan. For logistics equipment, that's especially true for rotating assets such as motors, bearings, and gearboxes.
Prescriptive approaches sit on top of predictive work. They use equipment condition, failure history, and operating context to recommend the best action and timing. They are only useful when the underlying failure modes are already mapped well.
A common blind spot is legal and safety compliance. Racking, dock interfaces, and structural support systems often don't fail like rotating equipment, but they still require disciplined review. For teams responsible for warehouse structures as well as machinery, this summary of racking inspection legal requirements is useful because it frames inspection obligations in an operational context rather than treating them as an afterthought.
Maintenance Strategy Comparison for Logistics Equipment
| Strategy | Description | Best For | Cost Profile | Primary KPI |
|---|---|---|---|---|
| Reactive | Repair after failure | Non-critical, easy-to-replace assets | Low planned cost, high disruption risk | Unplanned downtime events |
| Preventive | Time-based or cycle-based tasks | Known wear items and routine service points | Moderate recurring labor and parts | PM compliance |
| Predictive | Condition-based intervention | Critical rotating equipment with detectable degradation | Higher upfront program cost, lower surprise failure exposure | Planned work from condition findings |
| Prescriptive | Data-guided optimization of action and timing | Mature sites with strong data discipline | Depends on data infrastructure and execution maturity | Decision quality tied to reliability outcomes |
Plants comparing programs usually find that the core argument isn't predictive versus preventive. It's whether each asset has a credible failure pattern, an observable warning period, and enough consequence to justify monitoring. That's the same logic behind choosing predictive vs preventive maintenance in industrial reliability planning.
Implementing a Data-Driven Reliability Program
The program usually breaks long before the breakdown report proves it. A sorter drive fails, the team replaces a bearing, and the work order closes as "fixed." Three months later, the same location fails again. At that point the plant does not have a repair problem. It has a data quality problem, because the history cannot separate bearing fatigue from contamination, misalignment, overloading, or poor installation.
Clean data beats more data
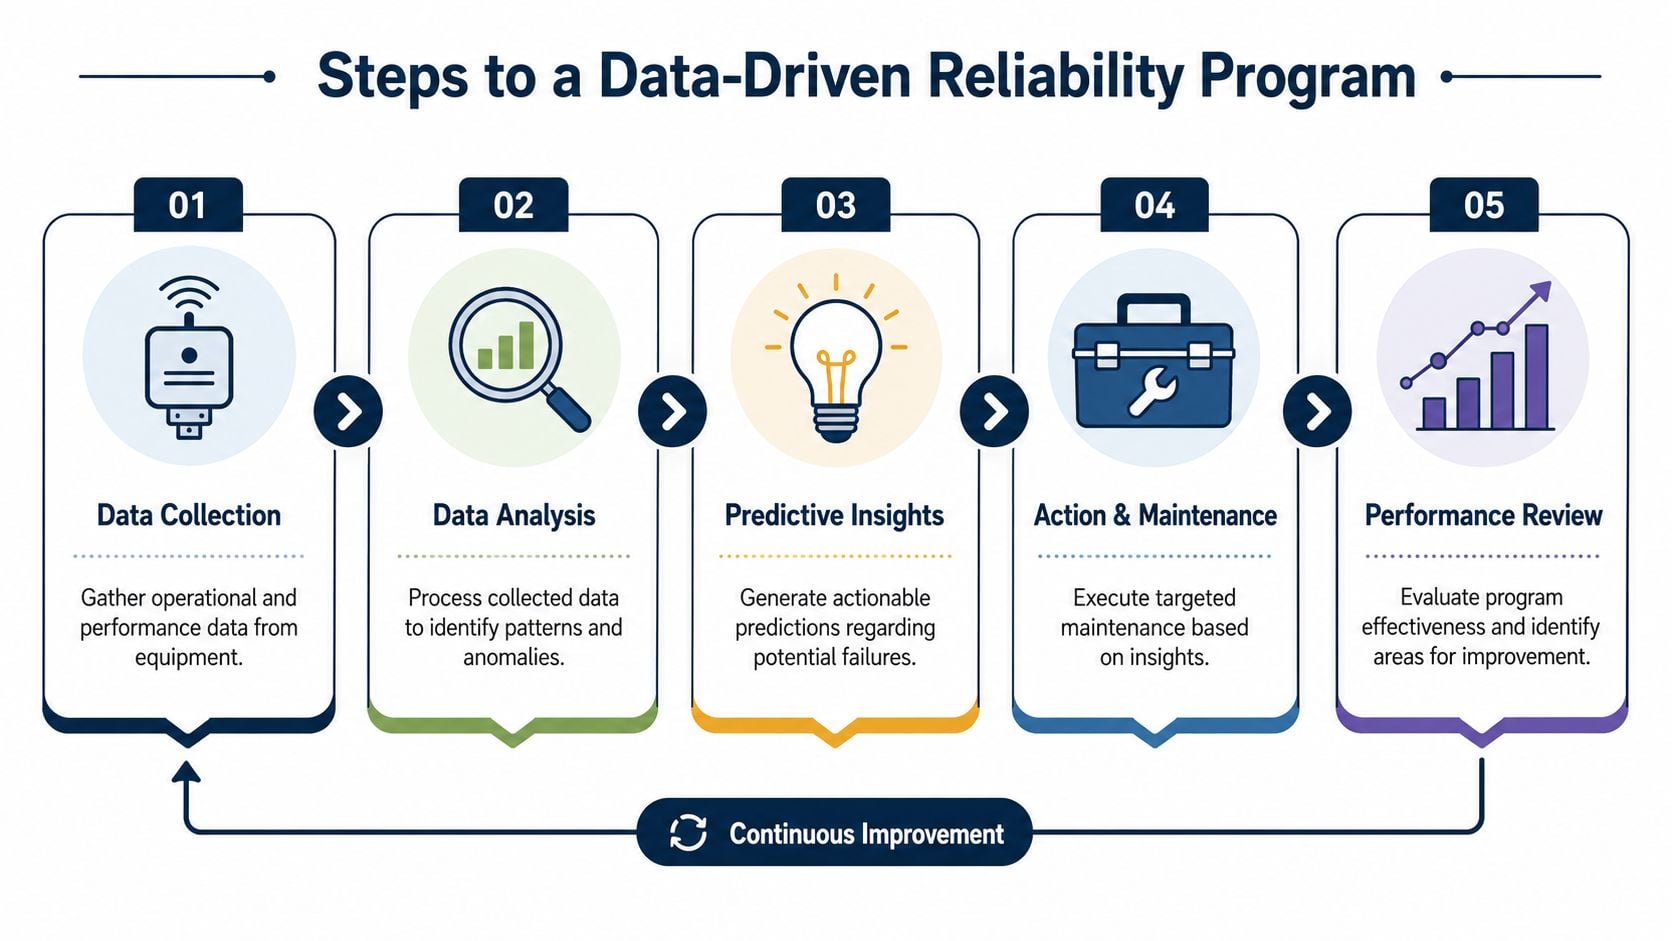
A data-driven reliability program starts with structure. The CMMS has to mirror how the equipment fails in real life. If conveyor assets are lumped into one line item, no one can tell whether the chronic issue sits in a take-up bearing, a specific motor, a photo eye bracket, or a VFD-fed drive section. If the hierarchy is too detailed, technicians stop using it correctly. The practical target is enough granularity to isolate repeat failures without turning work order entry into office work.
That is where FMEA and criticality ranking become useful on the plant floor instead of staying in a spreadsheet. High-consequence assets need failure codes tied to specific failure modes and causes. "Repaired conveyor" is not a failure history. "Head pulley bearing seized, caused by misalignment, accelerated by contamination ingress" is a record a planner can use. It supports better PM task design, better spare stocking, and better condition-monitoring decisions.
Machine learning only helps after that foundation is in place. If the site has not defined which failure modes matter, which assets are critical, and what warning signs appear before loss of function, the model output will be noisy and hard to trust. Teams need the physics first, then the automation.
What to measure and what those numbers mean
Three metrics carry most of the load in logistics equipment reliability:
- MTBF: Useful for spotting repeat failures on assets such as conveyor drives, rollers, sensors, and lift mechanisms.
- MTTR: Useful for finding maintainability problems such as poor access, missing spares, long fault isolation time, or unsafe repair setup.
- OEE: Useful for connecting maintenance decisions to throughput, blocked flow, and missed shipping windows.
Those metrics are only as good as the work order closure behind them.
A bearing failure is a good example. Vibration analysis often works well because rolling element bearings usually degrade in stages that can be detected before seizure. But if every event is coded as "motor repair," the site loses the link between symptom, failure mode, and cause. The result is weak trend analysis, weak bad-actor ranking, and weak input for any predictive model.
The better approach is simple and disciplined. Require technicians and planners to close work with four fields that match the FMEA: failed component, observed failure mode, likely cause, and corrective action. That creates data a reliability engineer can sort by consequence and recurrence. It also shows whether the plant is fixing the defect or just restoring operation.
Build the program around decisions, not dashboards
Plants do not need more charts. They need clearer triggers for action.
For critical logistics equipment, the program should answer a few practical questions. Which failure modes justify condition monitoring because they have a detectable warning period? Which ones still need scheduled replacement because degradation is hard to detect? Which assets can stay run-to-failure because the consequence is low and replacement is fast? That decision logic is what turns raw CMMS history into a maintenance strategy.
Outside support can help when a site lacks bandwidth for route collection, alarm review, or CMMS cleanup. Forge Reliability is one example of a provider that supports condition monitoring, predictive maintenance, and reliability consulting tied to FMEA, criticality ranking, and CMMS governance. For managers deciding where AI belongs in a real plant setting, these 10 real-world AI manufacturing examples are useful because they show applied use cases rather than broad claims.
Take Control of Your Logistics Equipment Reliability
A strong logistics equipment program doesn't begin with sensors. It begins with judgment. The plant has to know which assets matter most, which failure modes deserve attention, which diagnostic method fits each problem, and where reactive maintenance is still acceptable.
That's the shift from maintenance as response to maintenance as control. FMEA gives the ranking logic. Failure taxonomy gives the language. Condition monitoring provides earlier visibility. A blended strategy keeps the plant from overspending on low-risk assets while still protecting the systems that carry throughput.
What disciplined reliability looks like on the plant floor
In practical terms, a controlled program usually looks like this:
- Critical assets are defined clearly: Main sorters, primary conveyor drives, AS/RS lift systems, palletizer power units, and safety-related dock equipment are identified as high consequence.
- Failure modes are written specifically: Teams document seized bearing, misalignment, contamination, looseness, sensor drift, hydraulic leakage, and structural fatigue instead of generic “equipment failed.”
- Detection methods are matched intentionally: Bearings get vibration or ultrasound. Electrical hot spots get thermography. Hydraulic systems get oil analysis. Structural issues get formal inspection and engineering review.
- Work gets planned before failure: The warning period on the P-F curve is used to schedule action, stage parts, and avoid emergency response.
Plants that do this well usually notice a cultural change before they notice a reporting change. Technicians stop chasing the same failures. Planners stop guessing which spare parts to keep close. Operations begins to trust maintenance windows because the work is tied to actual risk.
Why action matters now
The pressure on logistics equipment keeps rising as facilities add automation, compress schedules, and ask the same assets to run harder with less interruption. That makes reliability a plant leadership issue, not just a maintenance department issue.
The good news is that most sites don't need a complete rebuild of their maintenance philosophy. They need a sharper framework and better execution. Start with asset criticality. Define the failure modes that drive downtime. Use the right diagnostics for the right assets. Build data discipline into every work order. Then improve the strategy one equipment class at a time.
The plants that get ahead aren't the ones with the most dashboards. They're the ones that can explain why a conveyor motor is at risk, how early the site can detect that risk, and what action should happen before throughput is affected.
Forge Reliability helps industrial teams build that kind of program through predictive maintenance, condition monitoring, and reliability consulting designed for plant-floor reality. For sites that need a practical roadmap for conveyors, sortation systems, dock equipment, and other logistics equipment, request a free reliability assessment from Forge Reliability.