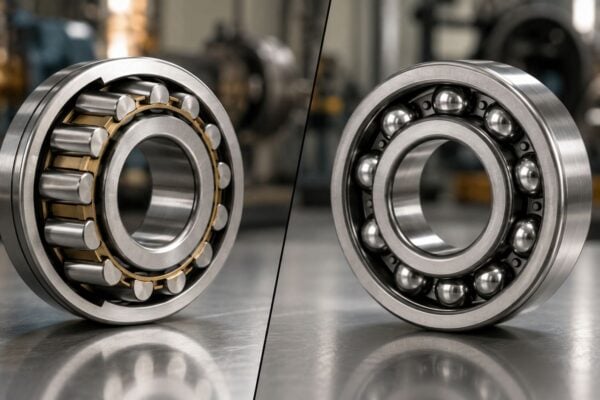
The most expensive asset in a plant isn't automatically the most critical one. That assumption produces polished spreadsheets and poor maintenance decisions. A bypass valve with a modest replacement cost can isolate an entire process line, while a large turbine with installed redundancy may tolerate a failure without stopping production.
System equipment reliability prioritization works only when it reflects the plant's operating context. The useful question isn't, “What did this asset cost?” It's, “What happens to safety, throughput, quality, recovery time, and maintenance capacity when this function is lost?” That shift matters as plants move from reactive repairs toward condition-based and predictive maintenance, often with incomplete CMMS histories and uneven sensor coverage.
A major 2024 Siemens analysis of industrial plant downtime found that an average large facility still loses 27 hours per month to unplanned downtime, despite improvement from 39 hours in 2019. The same analysis estimated average annual losses of about $253 million for large plants, with automotive sites around $695 million and heavy industry sites around $59 million. Those figures make prioritization a business-continuity decision, not an equipment-inventory exercise.
Table of Contents
- Rethinking Asset Criticality Beyond Price Tags
- Gathering Reliable Data in Messy Environments
- Selecting the Right Scoring Model and Criteria
- Translating Rankings into Actionable Maintenance Tiers
- Managing Dynamic Dependencies and Process Shifts
- Establishing Governance and Next Steps
Rethinking Asset Criticality Beyond Price Tags
A cheap component can carry the highest operational risk in a plant. A cooling pump with no bypass may stop a production line, while an expensive turbine with parallel equipment, stored spares, and a tested load-transfer procedure may remain manageable after failure. Replacement value describes recovery cost. It does not describe the consequence of losing a function.
The practical unit of analysis is the asset function inside the process topology. Process topology shows how equipment is connected, where flow can be diverted, and which components serve as single points of failure. Assess each pump in relation to the process it supports, the standby capacity available, and the time required to restore flow. Motor size and purchase price are supporting details.
Start with the consequence of lost function
Consider a food-processing line with two identical transfer pumps. One feeds a washdown circuit. The other supplies a temperature-controlled process step that requires continuous flow. They may share the same model, duty rating, and maintenance instructions, yet their functional consequences differ sharply.
Failure of the process pump could create:
- Throughput loss, because the line cannot continue at its required rate.
- Product-quality exposure, if temperature or residence time moves outside specification.
- Safety or environmental risk, if loss of cooling creates an unsafe operating condition.
- Recovery delay, if the replacement seal or cartridge is not held locally.
- Labor competition, because the same technicians may be needed for another emergency.
Map each asset to the process function it protects, the downstream equipment it affects, and the recovery path available after failure. This mapping also exposes a data-readiness problem. If the CMMS records only a generic pump tag and the process drawings are outdated, the score may look precise while resting on an incorrect failure path. Validate the relationship with operators, technicians, isolation procedures, and current line documentation before assigning a tier.
Practical rule: Rank the consequence of losing the function before ranking the value of owning the equipment.
The downtime context remains substantial. A 2026 manufacturing-maintenance industry report stated that unplanned downtime costs the world's 500 largest manufacturers $1.4 trillion annually, equal to 11% of total revenue, compared with $864 billion in 2019. It also reported that 82% of manufacturers had experienced unplanned downtime in the previous three years, while 80% of stoppages were still traced to equipment failure. These figures support concentrating reliability work on assets that can interrupt a bottleneck, utility, or safety-critical function.
Include redundancy without trusting it blindly
Redundancy lowers risk only when the backup works under actual plant conditions. A standby pump may be unavailable because its suction valve is shut, its automatic start circuit is defective, its motor is uncoupled, or operators have not tested the changeover. The equipment list may show two pumps, while the process still has one usable path.
Review each backup against five conditions:
- Available, with valves, controls, power, and auxiliaries ready.
- Capable, with enough flow, pressure, and operating range.
- Independent, without a shared failure-prone utility or control circuit.
- Tested, through documented start, transfer, and return-to-service checks.
- Repairable, with parts and specialist support accessible.
A structured redundancy planning approach helps expose the difference between installed redundancy and effective resilience. Rank equipment and process lines by the safety, revenue, and throughput losses they can create; replacement cost belongs in the recovery-cost column, not the criticality column.
Gathering Reliable Data in Messy Environments
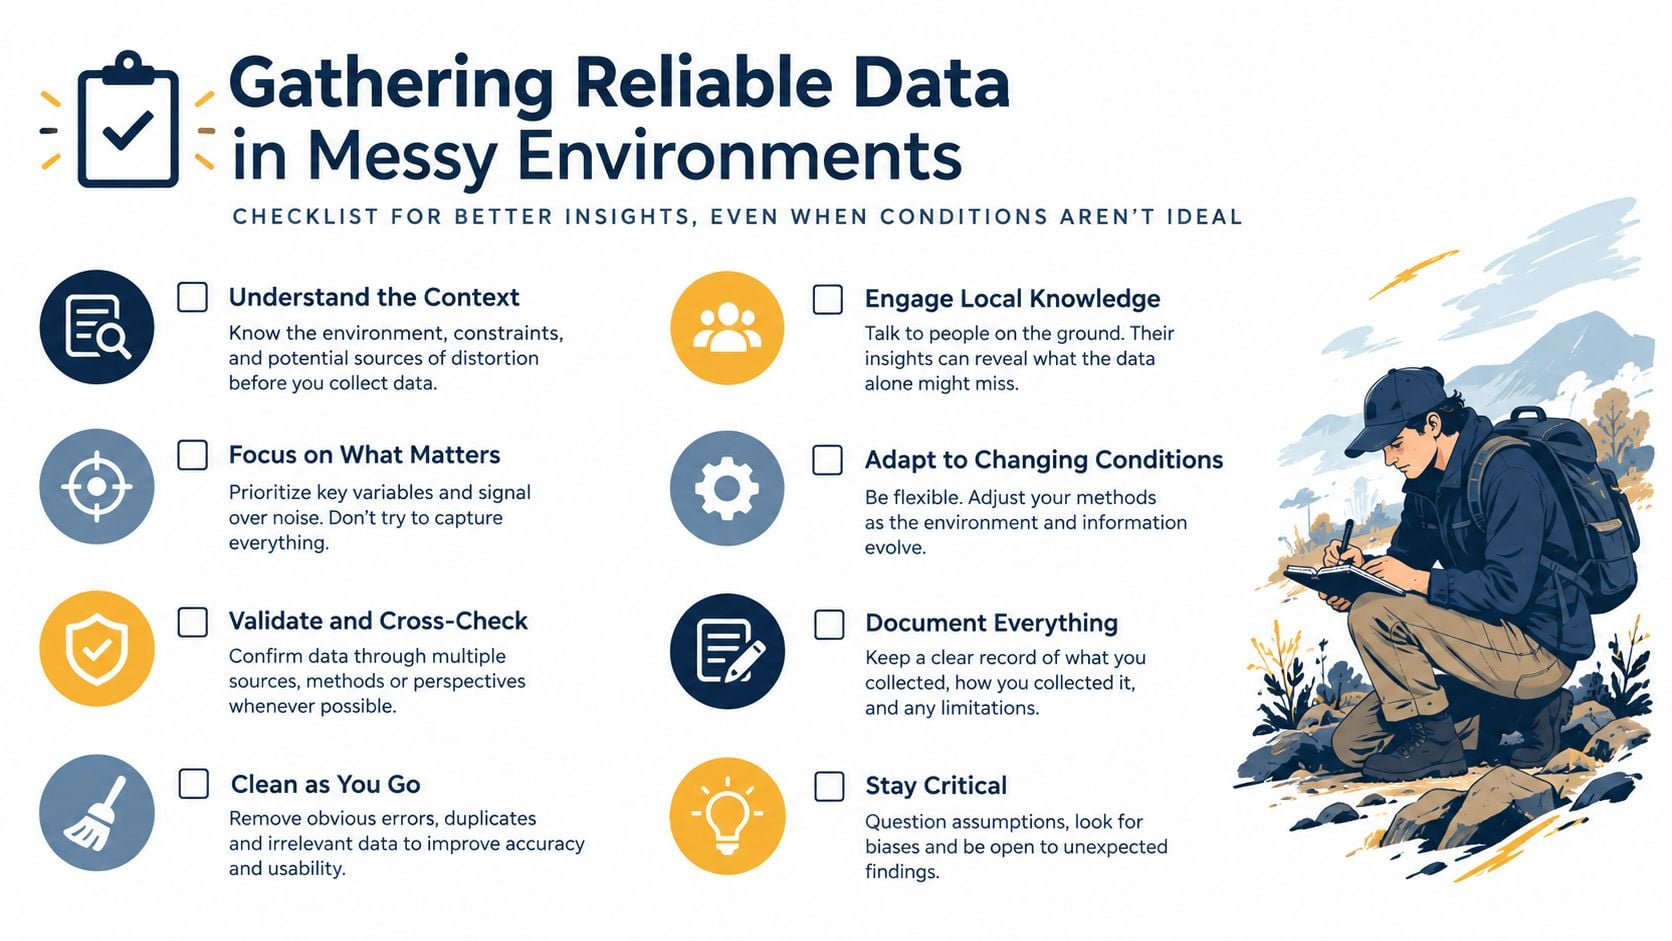
The hardest part of system equipment reliability prioritization is often not selecting a scoring method. It's deciding whether the available evidence is trustworthy enough to support a decision. CMMS records may contain vague descriptions such as “pump issue,” while operator logs use local abbreviations, vibration routes are irregular, and sensor readings contain gaps caused by installation changes or communication faults.
A weak dataset doesn't justify paralysis. It does require the team to distinguish business impact from diagnostic confidence. Business impact asks what a failure would do. Diagnostic confidence asks how reliably the plant can detect a developing problem.
Build a usable evidence base
Start with a complete asset list, but don't treat the CMMS export as the truth. Reconcile tags against line drawings, electrical one-lines, operator rounds, isolation procedures, spare-parts stores, and the knowledge held by technicians. A missing asset parent or duplicate tag can distort both the ranking and the maintenance history attached to it.
The practical workflow has seven parts:
- Build the asset list. Include equipment, subsystems, controls, utilities, and protective devices that can interrupt a function.
- Define weighted criteria. Agree on safety, environmental, quality, throughput, repair cost, recovery time, and maintainability.
- Assess failure likelihood. Use work orders, inspection findings, operator observations, age, duty severity, and known failure modes.
- Evaluate consequences. Record what stops, what becomes unsafe, what product is exposed, and how recovery would occur.
- Apply the scoring model. Keep assumptions visible, including missing history and uncertain likelihood.
- Assign criticality ranks. Place assets into practical bands that maintenance and operations understand.
- Embed the result. Connect rank to inspection frequency, monitoring coverage, work-order urgency, and spares.
This workflow aligns with the practical asset criticality analysis method, which also warns against stopping at a score. A ranking has value only when it changes planning and execution.
Use imperfect histories without overfitting
Sparse work orders can still reveal useful patterns. Search for repeated symptoms, not only failure labels. “Low discharge pressure,” “hot bearing,” “seal replacement,” and “motor overload” may describe the same developing pump problem even if the CMMS never identifies the root failure mode.
Operator logs often add the missing context. A technician may know that a compressor trips only during a particular product campaign, or that a gearbox runs hot after a guard modification. That knowledge should be recorded as an observation with an owner and confidence level, not converted into fact without review.
Condition data needs the same discipline. A noisy vibration signal may reflect a loose sensor, changing speed, process variation, or a genuine bearing defect. Before deploying an algorithm or increasing alarm sensitivity, verify sensor location, measurement repeatability, operating state, and calibration. Teams moving from route-based checks to continuous monitoring should establish a baseline under known healthy conditions and flag data gaps instead of filling them with assumptions.
Separate impact from confidence
A high-impact asset with weak diagnostic data deserves attention, but not necessarily an immediate full sensor deployment. The first intervention may be a better inspection route, a repeatable ultrasound or vibration measurement, a functional test of standby equipment, or improved failure coding.
The decision matrix should show both dimensions:
| Business impact | Diagnostic confidence | Recommended response |
|---|---|---|
| High | High | Apply targeted condition monitoring and defined intervention limits |
| High | Low | Improve data capture while adding temporary safeguards and functional checks |
| Low | High | Monitor only if the cost and workload are justified |
| Low | Low | Use basic preventive care or run-to-failure where consequences are acceptable |
A condition-monitoring systems resource can help teams compare route-based and continuous approaches, but technology won't repair an unstructured asset hierarchy. Data readiness must be treated as a reliability criterion, not an afterthought.
Selecting the Right Scoring Model and Criteria
A consequence-likelihood matrix is usually the right starting point because operations teams can understand it quickly. It combines the probability of a credible failure with the severity of its consequence, then places the asset into a risk band. The model becomes more useful when the consequence side includes safety, environmental impact, product quality, throughput, recovery time, and maintainability rather than downtime cost alone.
For complex systems, Failure Modes and Effects Analysis, or FMEA, provides more resolution. FMEA lists how an asset can fail, what causes each failure, what effect follows, and how the current controls perform. A common Risk Priority Number, or RPN, is calculated as:
RPN = Severity × Occurrence × Detectability
Severity measures the consequence. Occurrence estimates how often the failure mode may arise. Detectability reflects how likely the current controls are to identify the problem before functional failure. The result supports comparison, but it isn't a substitute for engineering judgment. A low occurrence score shouldn't erase a catastrophic consequence, and a high detectability score shouldn't imply that the asset is safe if the detection method is unreliable.
Example with a process air compressor
Consider a plant air compressor supporting pneumatic valves across a production line. The compressor may not be the most expensive asset on site, but loss of instrument air can place the line in a safe state, interrupt production, and complicate restart.
A practical FMEA might assess these failure modes:
- Bearing degradation: Rising vibration and temperature can progress to rotor damage or a trip. The team may detect it through vibration, temperature, and lubrication checks.
- Oil carryover or separator failure: Contamination can affect downstream pneumatic equipment and product processes. Oil analysis, differential-pressure trends, and visual checks may provide evidence.
- Cooling restriction: High discharge temperature can trigger a shutdown. Thermography, airflow checks, and temperature trending can expose deterioration.
- Control or pressure-switch failure: The compressor may fail to load, unload, or maintain required pressure. Functional tests and alarm verification are more relevant than vibration data.
Suppose the bearing failure mode receives Severity 8, Occurrence 4, and Detectability 6 on a plant-defined scale. Its RPN is 192. Those values aren't universal facts, and they shouldn't be copied from another facility. The team must define what each score means, document the evidence behind it, and validate the result against actual loss events.
A risk priority number guide can support the calculation, but the model still needs local calibration. A compressor serving a secondary workshop shouldn't receive the same business-criticality score as one supporting a bypass-free production line.
Weight the dimensions deliberately
A useful model makes trade-offs visible rather than hiding them inside a single unexplained number. One approach scores subsystem criticality on a 1–10 scale using safety, environmental impact, annual repair cost, throughput, and product quality, then multiplies that score by the asset's process criticality ranking to produce a business-criticality ranking. This approach is described in industrial guidance for subsystem and business criticality, and it applies well to pumps, motors, and compressors.
| Dimension | Evaluation focus | Example metric |
|---|---|---|
| Safety | Potential for injury, hazardous release, or loss of protective function | Consequence category |
| Environment | Spill, emission, discharge, or containment exposure | Environmental consequence band |
| Throughput | Effect on bottleneck capacity and line continuity | Production function lost |
| Quality | Risk of off-specification product or contamination | Quality disposition required |
| Repair cost | Labor, parts, contractor support, and outage work | Expected repair burden |
| Maintainability | Access, isolation, lifting, skills, and restoration complexity | Recovery difficulty |
| Detectability | Ability to identify degradation before failure | Confidence in available controls |
OEM recommendations remain useful for understanding design limits and common failure modes. They shouldn't determine plant criticality by themselves. The equipment's actual duty, process location, operating variability, bypass status, and spare-parts exposure matter more than its generic design rating.
Translating Rankings into Actionable Maintenance Tiers
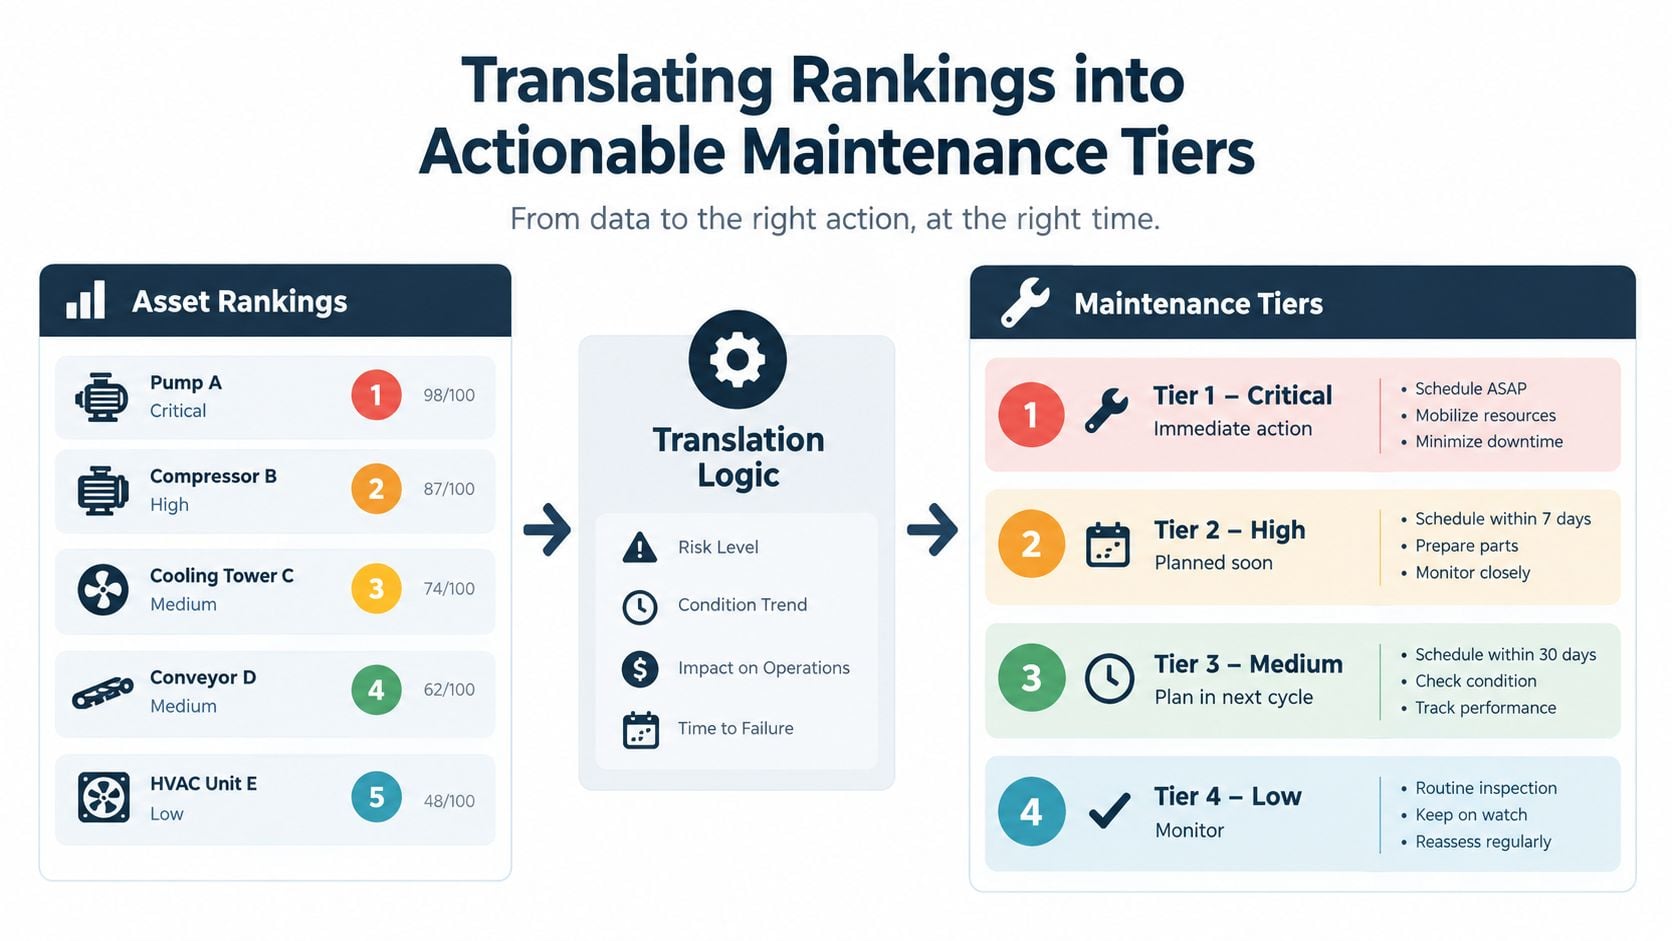
A ranking has value only when it changes maintenance behavior. The assigned tier should determine inspection methods, planning priorities, spare-parts decisions, response times, and which work orders may safely wait. That translation becomes harder when CMMS histories are incomplete or condition data is sparse. Use the score as a decision aid, then state the evidence behind it and record the uncertainty.
Three broad tiers usually provide enough discipline without creating false precision.
Critical assets
Critical assets protect safety, environmental containment, a bottleneck, or a function with no credible bypass. They generally warrant continuous or condition-based monitoring when the failure mode supports it. A critical motor may need vibration, temperature, motor-current, thermography, and defined operating-state checks. A seal-sensitive pump may need leakage inspections, bearing vibration, oil-condition checks, and process-performance trends.
Sparse data changes the operating rule. If the plant lacks a dependable baseline, start with a short verification route and capture readings under known operating conditions before setting alarm limits. A noisy signal should trigger validation, not automatic escalation or dismissal.
Work orders for these assets need clear escalation rules. A rising bearing trend should not sit in the same queue as a routine guard inspection. The response should identify the decision owner, permitted operating condition, required spare, and available outage window.
Essential assets
Essential equipment affects production or quality but has a workable standby, bypass, or recovery plan. Route-based vibration, oil analysis, thermography, functional testing, or operator rounds may be appropriate. Set frequency according to failure-development behavior and consequence, not a generic calendar.
Spare-parts strategy matters. A common seal or bearing may not need a dedicated buffer when local stock and interchangeability are reliable. A proprietary control card or long-lead coupling may justify a defined stock level even if the asset is not continuously monitored. Incomplete purchasing or failure records should lower confidence in the assumption, not conceal the exposure.
Non-critical assets
Non-critical equipment can use basic preventive tasks, inspection, or controlled run-to-failure when the consequence is acceptable. Run-to-failure is a planned choice, not neglect. It requires a known replacement method, safe isolation, reasonable parts access, and no unacceptable effect on production or compliance.
Match tasks to physical failure modes
Reliability-Centered Maintenance, or RCM, starts with the required function and traces the physical ways that function can fail. Bearing wear, seal leakage, electrical shorting, fouling, and loss of calibration need different tasks. Scheduled restoration may suit a known wear mechanism. Condition monitoring fits when degradation is measurable and intervention can occur before functional failure.
Common RCM task choices include:
- Condition monitoring, for measurable deterioration such as bearing vibration or oil contamination.
- Scheduled restoration, for restoring a component before a credible wear limit is reached.
- Scheduled discard, when replacement at a defined interval is justified.
- Failure-finding, for hidden protective or standby functions that are not evident during normal operation.
- Run-to-failure, when the consequence is acceptable and a proactive task offers little value.
A practical industrial benchmark is to treat the top 20–30% of assets as the critical set, concentrating predictive resources where operational risk is highest. The exact proportion should follow the plant's risk profile, not an arbitrary target. Where histories are incomplete, mark the ranking confidence and direct initial monitoring toward assets with high consequence and weak evidence.
A clear resource allocation approach helps planners concentrate scarce analysts, technicians, and outage windows on assets with different consequences instead of distributing effort evenly. Guidance on scheduling and work prioritization can also help teams boost uptime and cut costs.
Managing Dynamic Dependencies and Process Shifts
Criticality is a living model because the process is not static. Production campaigns change, lines are modified, utilities are shared, suppliers miss lead times, and a standby asset may be removed for overhaul. A pump that was previously classified as essential can become mission-critical when its parallel unit is unavailable.
The hidden variable is dependency. Equipment may be moderately important in isolation but decisive when it is the only bypass-free path to a bottleneck. Recovery cost can also change quickly when a specialist is unavailable or a replacement assembly has a long lead time.
Recalculate around operational events
A quarterly review is a practical rhythm for multi-site operators, provided it is triggered sooner by major changes. The review should examine:
- Process topology: Has a line, bypass, interlock, or utility connection changed?
- Operating mode: Is the asset now serving a different product, load, or campaign?
- Redundancy status: Is standby equipment available, tested, and independent?
- Recovery exposure: Have labor, contractor, lifting, or outage constraints changed?
- Parts availability: Have supplier delays or obsolescence altered restoration time?
- Condition trend: Has new evidence increased or reduced the likelihood of a failure mode?
- Business volatility: Has the value of lost throughput or energy-intensive operation shifted?
The result shouldn't be a disruptive rewrite of every CMMS record. Instead, record the reason for the change, update the criticality band, adjust the linked maintenance strategy, and notify affected planners and operators.
Use events to challenge old assumptions
A process change can invalidate a historical ranking without changing the equipment itself. If one of two cooling pumps is removed from service, the remaining pump inherits the dependency. If a product campaign makes contamination unacceptable, a previously tolerable seal leak may become a quality-critical failure.
A static matrix also misses supply-chain exposure. A motor may have a common local replacement, while a drive or control module requires specialist support. The latter can deserve a higher recovery score even if its historical failure frequency is low.
A criticality score should explain the current operating risk, not preserve an old meeting decision.
The living model should connect condition trend, business impact, and uncertainty. An asset with severe consequences and weak diagnostic confidence may need a temporary inspection route or functional test until better data is available. An asset with strong condition evidence but limited consequence may remain outside continuous monitoring if the intervention cost exceeds the avoided risk.
Establishing Governance and Next Steps
A plant can have a technically sound ranking and still defer the wrong work. Governance determines whether criticality affects daily decisions or remains buried in a spreadsheet.
A maintenance manager, operations leader, reliability engineer, planner, and process specialist should agree on the scoring definitions and approval path. Operations must confirm actual process consequences. Maintenance must validate failure modes and recovery effort. Reliability must test whether the selected monitoring method can detect the degradation early enough to act.
Make the ranking visible in daily work
The criticality band should appear in the asset record, work-order screen, job plan, spare-parts review, and outage list. A critical pump with a bearing alarm shouldn't be buried behind routine lubrication tasks. A non-critical ventilation fan shouldn't consume the same analytical effort as a compressor that controls instrument air.
Management reporting should connect rankings to decisions rather than display scores alone. Useful review questions include:
- Are critical assets covered by an appropriate inspection or monitoring task?
- Are hidden protective functions being tested?
- Are deferred work orders concentrated on high-consequence equipment?
- Do spare-parts buffers reflect recovery time and supplier exposure?
- Are failure codes specific enough to improve future scoring?
- Have process or redundancy changes triggered a review?
A structured EAM overview can help connect asset records, work management, planning, and lifecycle decisions. The system matters, but governance comes first. A detailed record with an incorrect function, stale dependency, or vague failure description still produces weak decisions.
Audit maturity through plant-floor evidence
A realistic audit starts with a sample of critical assets, such as a production-line pump, an instrument-air compressor, and a cooling-water motor. The team traces each from process function to failure mode, detection method, work-order priority, spare availability, and escalation rule. Any broken connection identifies a practical improvement, whether that means correcting the hierarchy, rewriting failure codes, testing a standby, or changing the inspection route.
The aim isn't to rank every asset perfectly on the first pass. It is to create a defensible model that improves as technicians, operators, and planners add evidence. System equipment reliability prioritization becomes valuable when it changes what the plant does before a failure, not when it just labels equipment as critical.
Forge Reliability can assess asset criticality, CMMS data quality, failure modes, condition-monitoring coverage, and spare-parts exposure to identify hidden downtime risks. Schedule a free reliability assessment through Forge Reliability to validate the plant's prioritization model and turn the highest-risk findings into an actionable maintenance plan.