A maintenance manager opens the morning report and sees two plants both showing 95% equipment availability. One has steady production; the other is chasing recurring pump trips, delayed repairs, and missed schedules. The percentage looks reassuring, but it doesn't tell the same story at both sites.
The difference may be the calculation, not the machines. If the plants use different time boundaries or classify changeovers, standby, and short stops differently, their scores aren't directly comparable. A useful equipment availability formula must do more than produce a percentage. It must give the team an auditable way to define what counts as available time and what counts as downtime.
Table of Contents
- Why Two Plants Can Both Claim 95% Availability and Be Worlds Apart
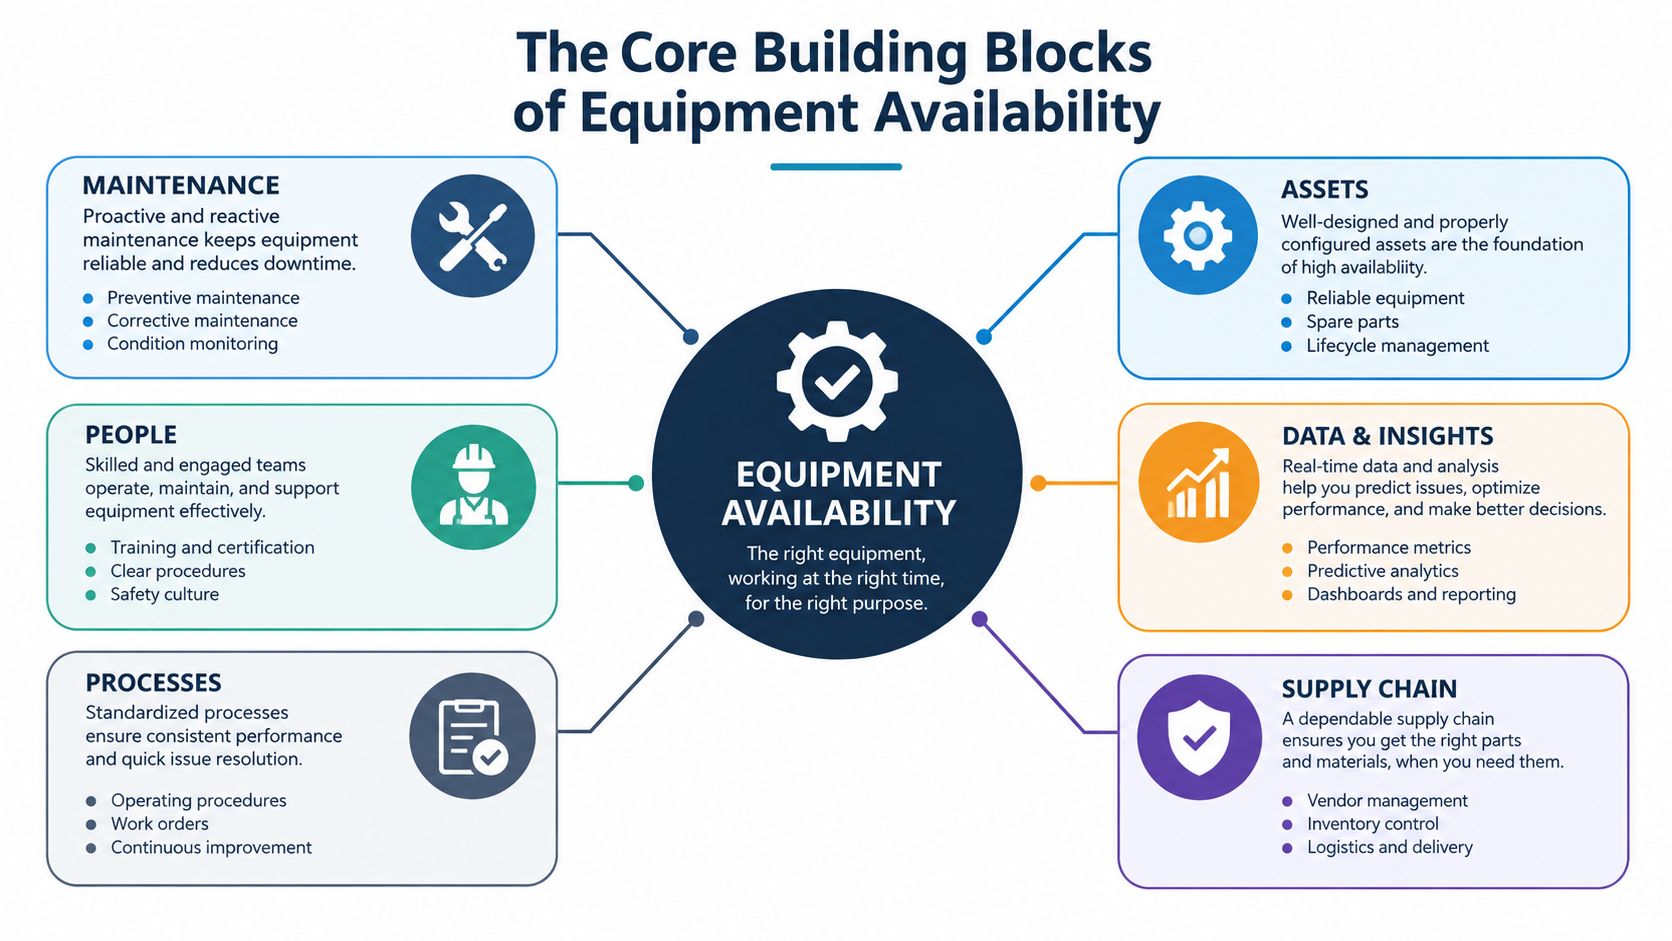
- The Core Building Blocks of Equipment Availability
- The Four Availability Formulas Compared
- Worked Example Using a Centrifugal Pump
- The Denominator Problem and Event Taxonomy
- Sourcing Clean Inputs from Your CMMS
- Five Pitfalls That Quietly Inflate Availability
- How to Actually Move the Number
Why Two Plants Can Both Claim 95% Availability and Be Worlds Apart
The first question isn't whether the reported score is right. It's what time the score measures. A plant might calculate availability only during scheduled production. Another might include additional hours when production wasn't planned. Even if both divide uptime by a time total, they can get different answers because their denominators differ.
The same issue appears in event coding. One team may record a changeover as downtime, while another excludes it from the availability calculation. A short interruption might be logged as a micro-stop at one site and disappear into a performance loss at another. Standby time can also be treated differently, even when the equipment isn't running.
Ask what the percentage includes
When an availability score changes, ask the maintenance planner to show the calculation and its inputs. Which hours entered the denominator? Which events reduced the numerator? Were planned maintenance, breaks, cleaning, material shortages, and operator delays treated consistently?
Those details matter when a line has a high reported score but still loses production to recurring faults. A pump that trips on low suction pressure can be unavailable when the failure is coded as a breakdown. If the same delay gets assigned to process waiting, the reported availability may rise without the pump becoming more reliable or easier to repair.
Practical rule: Treat availability as an auditable measurement system, not a standalone number. A score without a time boundary and event-coding rules can't support a reliable comparison.
The equipment availability formula helps answer a practical question: During the time the asset was expected to serve production, how much time was it able to do so? Before comparing plants, lines, or equipment, define that expected time and agree on how losses are recorded. That governance is the first reliability decision behind the metric.
The Core Building Blocks of Equipment Availability
Availability describes the share of a defined period when an asset is ready and able to perform its intended function. A delivery truck that is in the depot for a repair cannot make deliveries, even if the road is clear and the driver is available. A repaired truck may be ready for work without being assigned a route. The distinction between being ready and being used matters when a plant selects its calculation boundary.
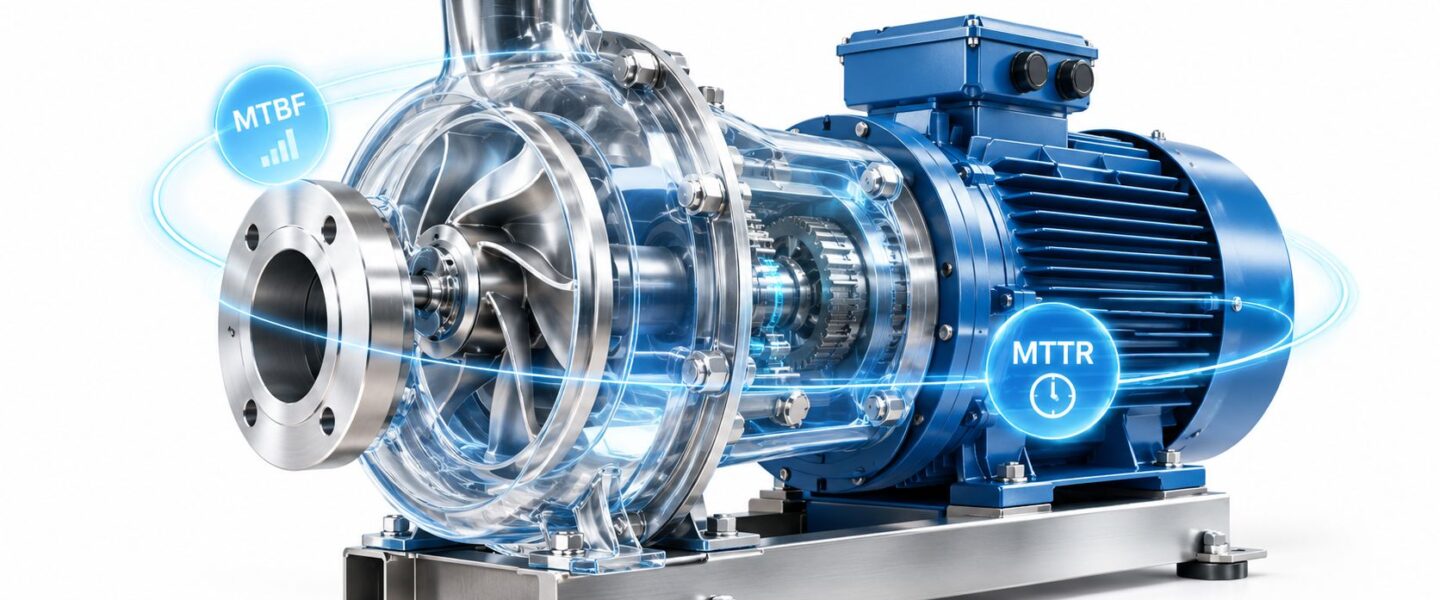
Two measures help describe why repairable equipment is or isn't ready. Mean time between failures (MTBF) is the average operating time between functional failures of a repairable asset. Mean time to repair (MTTR) is the average time required to restore function after a failure. MTBF describes how often failures occur; MTTR describes how long repairs take.
For example, a centrifugal pump with recurring bearing damage has a low MTBF compared with an otherwise similar pump that runs longer between failures. If technicians need less time to diagnose and replace the damaged bearing, MTTR falls. Improving either measure can support better availability, but they point to different actions: investigating the cause of repeated failures versus making diagnosis, access, parts, and repair work more effective.
Choose the metric that fits the equipment
Mean time between maintenance (MTBM) is used when the events of interest include maintenance actions, not only functional failures. Mean time to failure (MTTF) commonly describes the expected time to failure of a non-repairable item, such as a component replaced rather than repaired. These measures aren't interchangeable: the first two describe a repairable asset's failure and restoration pattern, while MTTF fits a different equipment question.
The reliability expression for availability combines MTBF and MTTR: MTBF ÷ (MTBF + MTTR). It captures the relationship between time spent operating between failures and time spent restoring the asset. That expression is useful for understanding reliability and repair performance, but it doesn't automatically match a production report that uses scheduled time or includes non-failure delays.
Teams that need to calculate MTBF consistently can use this guide to calculating mean time between failures. The key is to define what qualifies as a failure and which repair periods count before comparing assets.
The Four Availability Formulas Compared
An availability result depends on the question being asked. A reliability engineer examining failure-and-repair behavior needs a different boundary from an operations leader reviewing production losses. Naming the variant is essential: “availability” alone doesn't explain what entered the calculation.
Inherent availability focuses on the asset's failure and repair characteristics. It excludes planned maintenance and logistics delays, so it can help assess the equipment design and its basic maintainability. Achieved availability adds preventive maintenance time, making it useful when planned maintenance is part of the asset's maintenance program but logistics delays are still outside the boundary.
Operational availability broadens the view to the actual operating context. It can include administrative and supply delays as well as repair time, and the period may be based on calendar time or a defined operating schedule. OEE availability focuses on production time: it measures run time against planned production time, using the plant's rules for scheduled nonproduction periods and production losses.
| Variant | Numerator | Denominator | Typical Use |
|---|---|---|---|
| Inherent availability | Operating time | Operating time plus corrective repair time | Comparing basic equipment reliability and maintainability |
| Achieved availability | Operating time | Operating time plus corrective and preventive maintenance time | Assessing equipment maintenance performance |
| Operational availability | Time the asset is operational | Defined calendar or operating time, including specified logistics and administrative delays | Understanding availability in the real operating environment |
| OEE availability | Actual production time or run time | Planned production time or planned busy time, according to the adopted definition | Reviewing equipment time losses during planned production |
Use formulas as decision tools
The table is a starting point, not permission to mix definitions. Even the words operating time, run time, and planned production time need local definitions. Teams mapping how equipment depends on other equipment can use reliability block diagrams to help frame system-level availability questions.
ISO 22400-2 defines availability as actual production time divided by planned busy time. That boundary differs materially from the MTBF / (MTBF + MTTR) reliability expression and from OEE availability definitions, so the selected method should be named whenever the result is reported (ISO 22400-2). A maintenance dashboard should therefore state the formula, the time boundary, and the event rules beside the score.
Worked Example Using a Centrifugal Pump
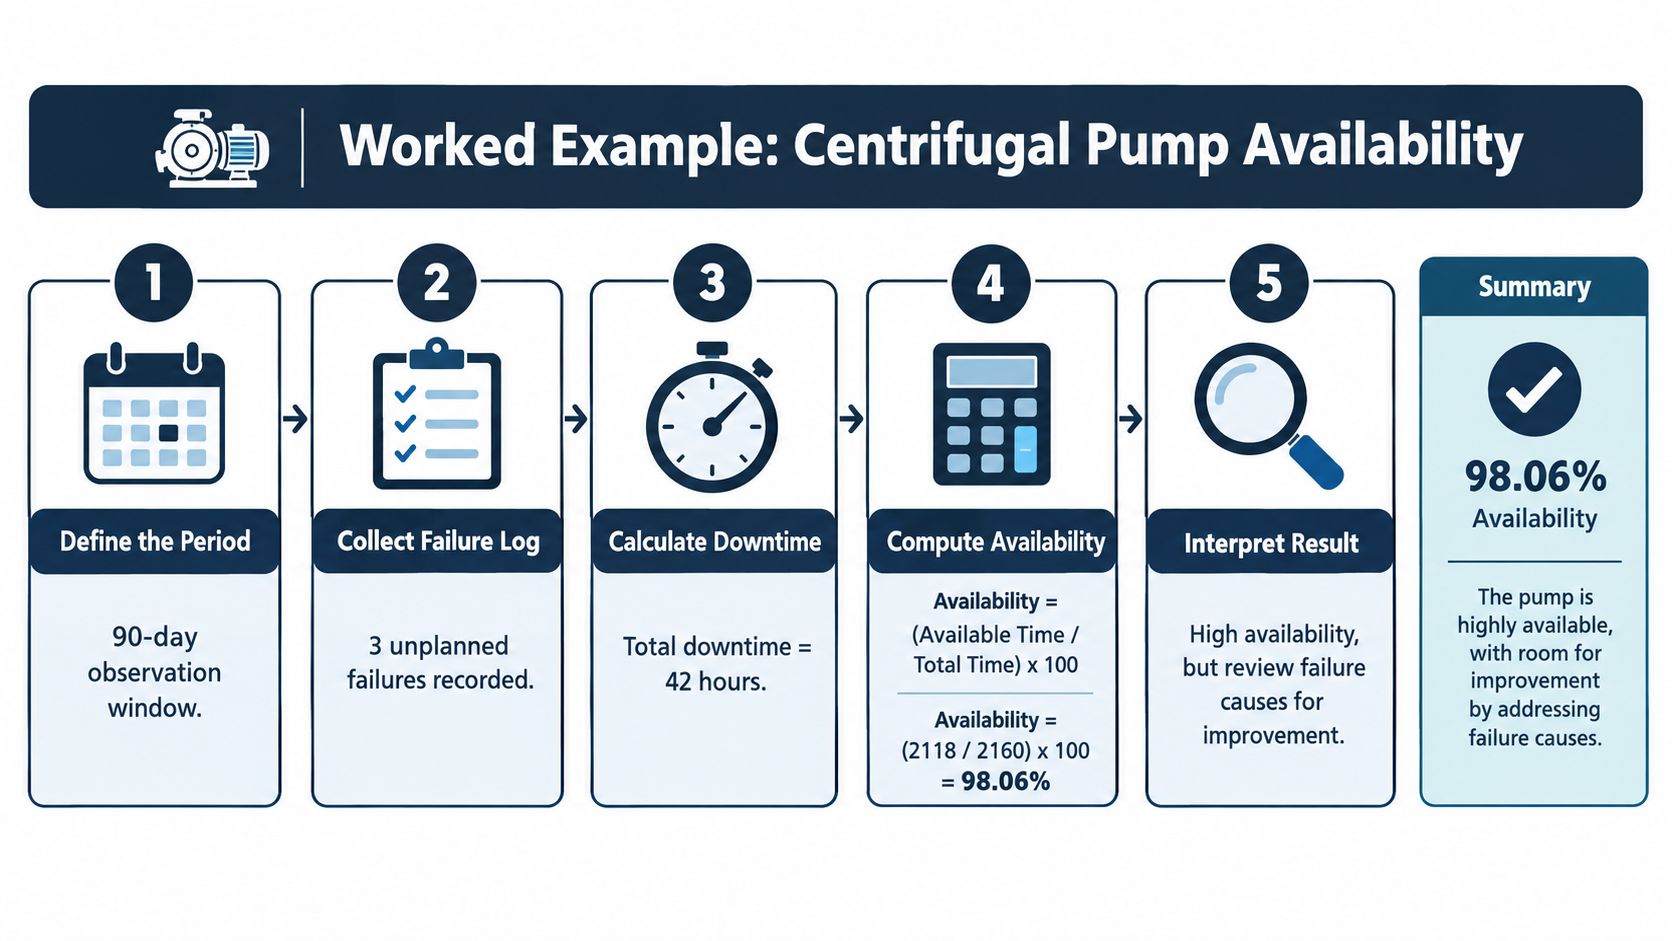
Consider a centrifugal pump serving a chemical process. The maintenance team wants to review it over a 90-day observation window. To make the calculation concrete, assume the plant schedules the pump to be available for production throughout that window and records three unplanned failures: a bearing failure, a mechanical seal leak, and an unplanned motor trip. Assume the repair durations total 42 hours, and there is also one scheduled overhaul.
These are illustrative inputs, not plant performance data. Calendar time in the observation window is 2,160 hours. If the scheduled overhaul lasts three hours, total recorded downtime is 45 hours. Under an operational boundary that includes the overhaul, available time is 2,115 hours, so the calculation is 2,115 ÷ 2,160 = 97.92%.
Separate failure behavior from the operating boundary
For MTTR, divide the unplanned repair downtime by the number of unplanned failures: 42 hours ÷ 3 = 14 hours per repair. For MTBF, use operating time between functional failures. If the plant's failure log records only those three events and the pump operated for 2,115 hours outside recorded downtime, an approximate calculation is 2,115 ÷ 3 = 705 operating hours between failures. The team must document whether it uses this convention or another consistent interval method.
The same inputs produce different results under different boundaries. Excluding the scheduled overhaul from the denominator gives 2,115 ÷ 2,157 = 98.05%. An inherent calculation based only on the three unplanned failures and their repair time gives 2,118 ÷ 2,160 = 98.06%. A production-based score could differ again if planned busy time excludes breaks or other scheduled nonproduction periods.
The point isn't that one result is automatically correct. Each answers a different question. For a pump, the failure record should also capture the mechanisms behind the event: seal leakage, bearing wear, or suction-side cavitation. Vibration analysis can help identify developing bearing damage, while process checks can test whether inadequate suction conditions are driving cavitation. A CMMS export becomes useful when each event has a clear start, end, failure mode, and downtime classification.
The Denominator Problem and Event Taxonomy
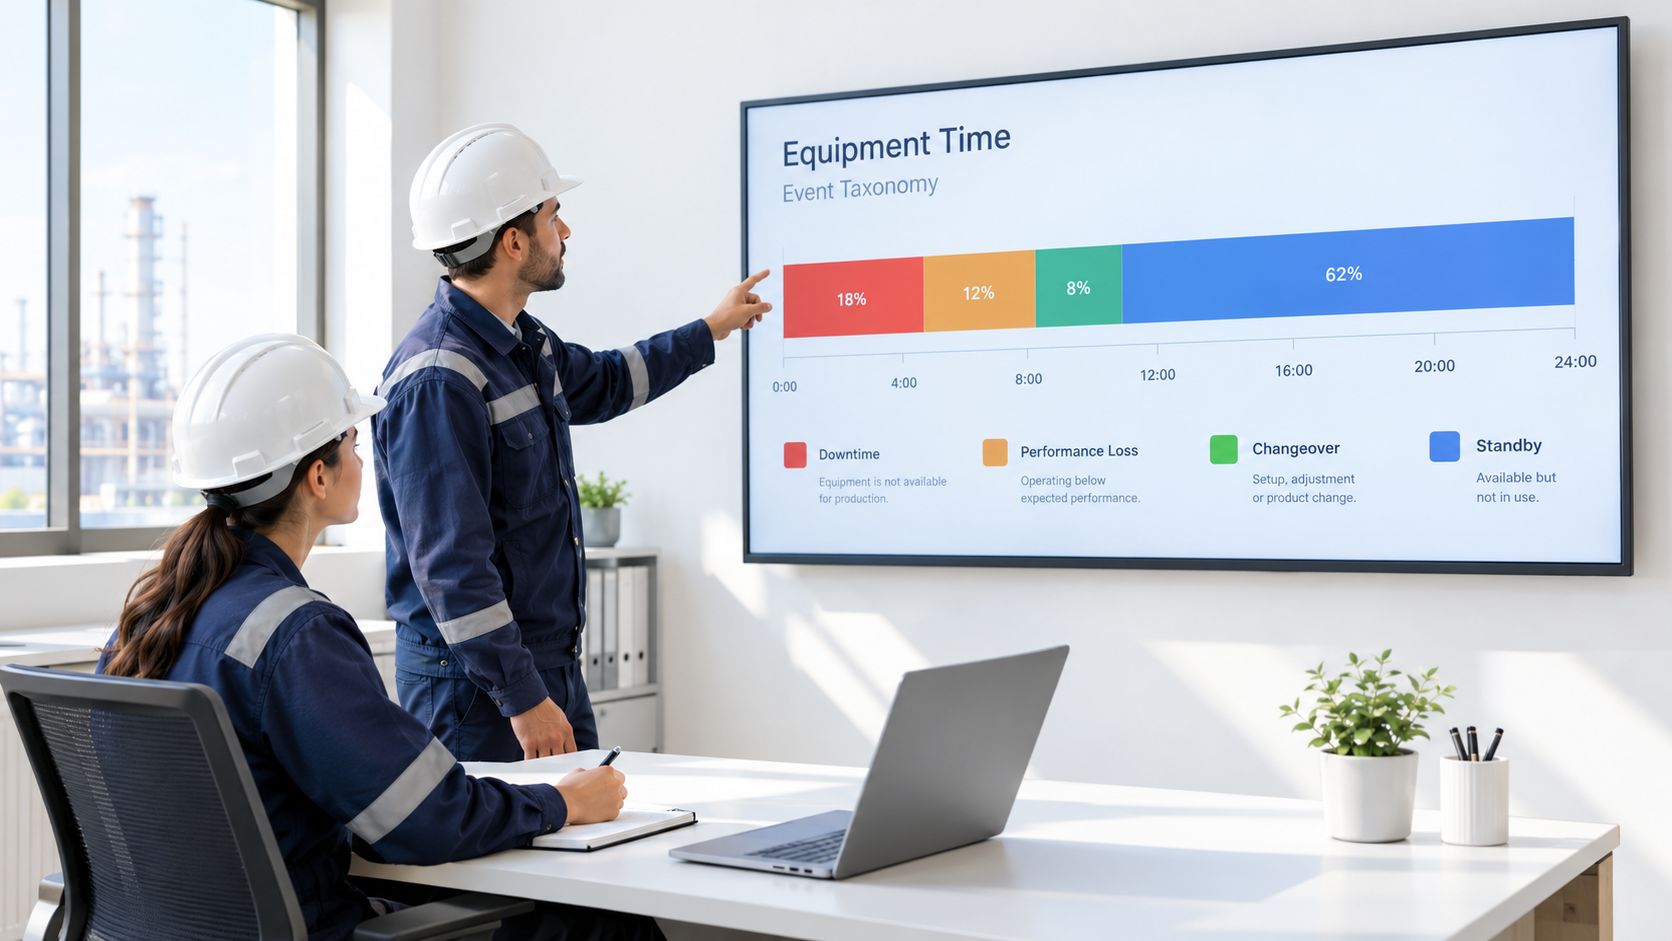
The denominator determines what time the calculation judges the equipment against. ISO 22400-2's definition uses actual production time divided by planned busy time, while a reliability calculation can use a different boundary. Scheduled nonproduction periods such as breaks, changeovers, and planned maintenance may be excluded in an OEE-style calculation, while an asset-management view may use calendar time or include scheduled downtime. Event models also differ in how they classify cleaning, material shortages, and short interruptions.
A practical reconciliation worksheet makes those choices visible. Start with the broadest time base, then subtract each excluded period using rules the plant has agreed to apply:
| Reconciliation stage | Questions to resolve |
|---|---|
| Calendar time | What full period is being reviewed? |
| Scheduled production time | Which breaks, nonproduction shifts, or planned closures are excluded? |
| Planned operating time | How are changeovers, cleaning, and scheduled maintenance treated? |
| Run time | Which recorded events stopped the asset from performing its intended function? |
Set rules for the gray areas
For each event, the plant should state how it handles CIP (clean-in-place), warm-up, waiting on material, operator delay, standby, and speed losses. A speed loss belongs in a performance category if the asset is running below its intended rate; a stoppage belongs in availability only if the event model defines it that way. The important part is consistency, not forcing every plant to use identical categories.
For micro-stops, teams can agree on a local threshold for how short events are logged, then apply it consistently and preserve the raw event data where possible. If stops below the threshold are rolled into performance loss, they shouldn't disappear from analysis. Maintenance and operations teams can use CMMS asset management practices to keep event definitions, equipment records, and reporting rules aligned.
Comparability test: Don't compare plants, lines, or vendors until they use the same time boundary and event taxonomy. A score can improve because a loss moved between categories, even when equipment uptime didn't change.
This denominator check answers a familiar puzzle: availability can rise while actual uptime stays flat. The cause may be a narrower denominator, inconsistent downtime coding, or a loss shifted from availability into performance. Auditing the reconciliation prevents a stronger-looking percentage from obscuring recurring pump, motor, gearbox, or process-equipment losses.
Sourcing Clean Inputs from Your CMMS
A formula can't rescue a poor event record. For each availability event, the CMMS should capture the equipment identifier, event start and end times, failure mode, and downtime type. Those fields let the reliability engineer connect a stoppage to a specific asset, identify the stated cause, and calculate duration against the selected boundary.
Standardize the codes before comparing crews or shifts. One crew might describe the same pump problem as “seal leak,” while another enters “mechanical failure.” Agree on a controlled list that distinguishes failure modes such as bearing damage, seal leakage, motor trip, suction restriction, and non-equipment delays such as material waiting. Keep a clear distinction between the failure mechanism and the operational event category.
Validate the timeline before calculating
Work orders aren't always a clean event log. A single repair may generate duplicate records, or two work orders may overlap because one covers troubleshooting and another covers parts replacement. The planner should identify the event's actual start and restoration times, merge duplicates for downtime reporting, and retain linked work orders for labor and maintenance history.
Condition monitoring can help test the timestamps and failure diagnosis. Vibration analysis can identify changes associated with bearing or rotor problems, and oil analysis can reveal wear or contamination that supports a failure investigation. These signals don't replace operator reports, but they help engineers check whether a recorded event aligns with physical evidence.
Reliable production records also support broader process discipline, including quality assurance in manufacturing, where consistent procedures and traceable records matter. For maintenance teams, a disciplined work order management process helps turn work orders into useful reliability inputs rather than a pile of unconnected repair notes.
Five Pitfalls That Quietly Inflate Availability
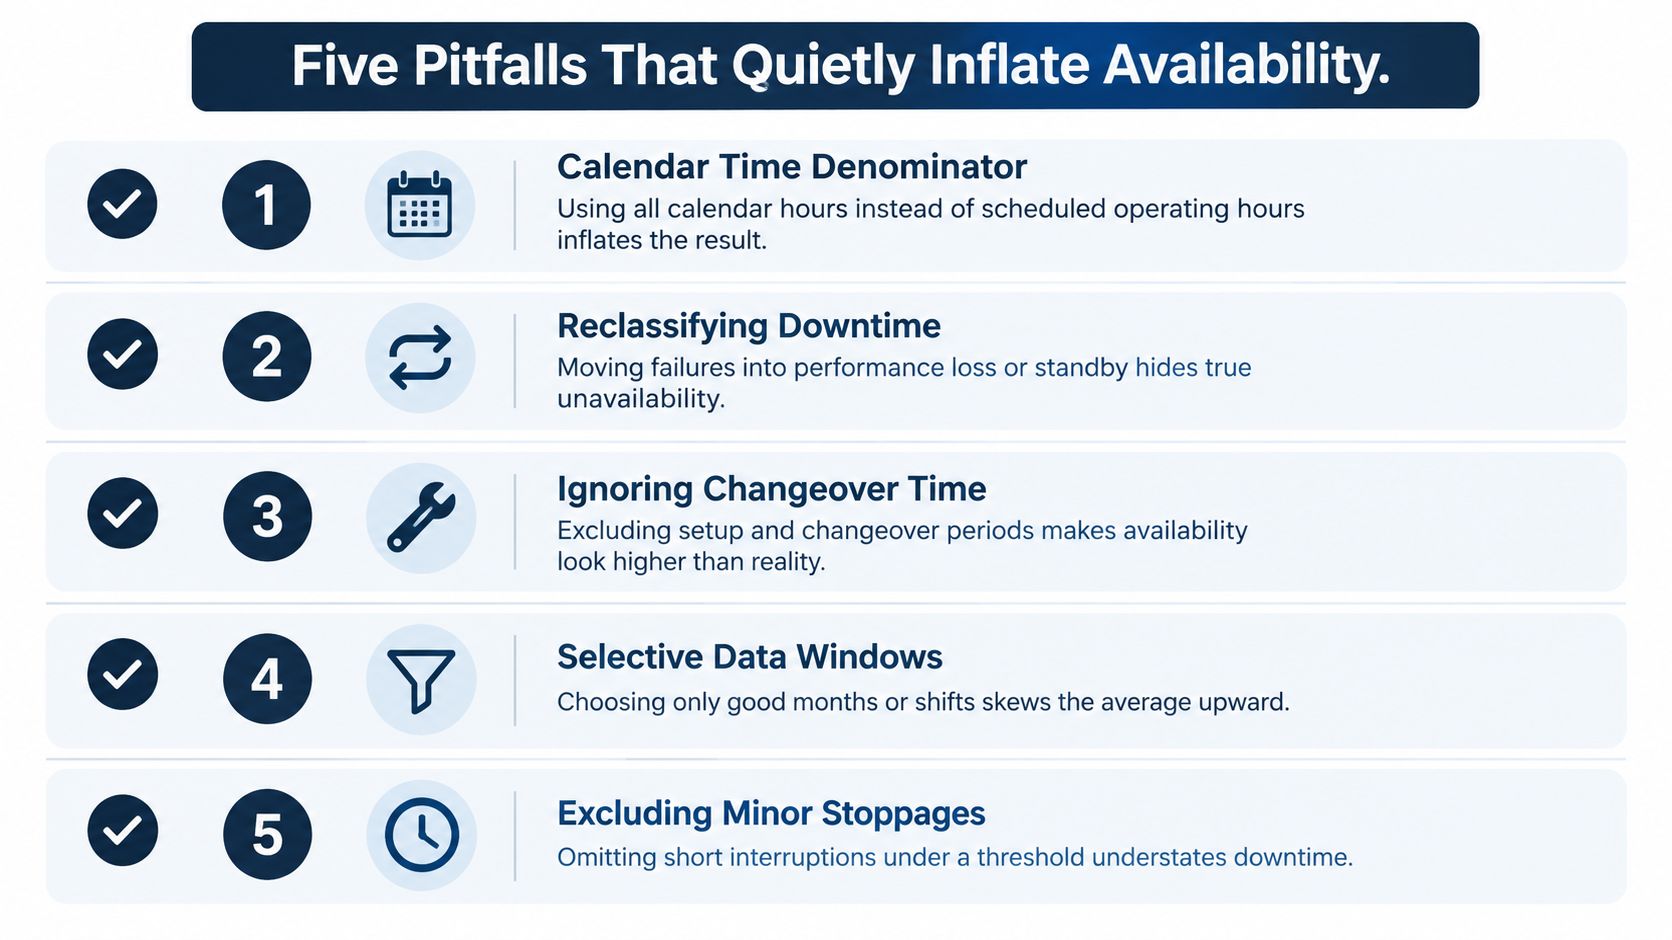
A rising score doesn't always mean the equipment got healthier. Maintenance managers can check for these failure points before accepting a report:
- Calendar-time mismatch: Using all calendar hours can hide idle periods when the asset wasn't expected to produce. Compare the reported boundary with the scheduled production plan.
- Failure relabeled as operator error: Repeated gearbox trips can be assigned to operator handling without checking the initiating fault. Require a failure mode and evidence-based cause review.
- Standby counted as uptime: A pump may be available as a standby unit, but that isn't the same as operating production equipment. Report readiness and actual use separately.
- Dissimilar assets averaged together: A fleet average can hide chronic seal leakage on one critical pump. Show asset-level results alongside any aggregate.
- Only one variant reported: A single availability figure can conceal differences between operational and production boundaries. Name the formula and publish the event rules.
Look for the failure behind the score
Each pitfall has a practical adjustment: reconcile the denominator, retain the failure mechanism, distinguish standby readiness from production, inspect asset-level variation, and state the formula. Those checks expose whether a high score reflects improved maintenance or changed reporting.
A recurring pump seal leak, for example, shouldn't disappear into a general “process delay” category without investigation. The team can review seal condition, alignment, operating conditions, and repair records to determine whether repeated events share a cause. A score only helps if it directs attention to an actionable loss.
How to Actually Move the Number
Reliable improvement starts with the failure mode, not the target percentage. On rotating equipment, route-based vibration analysis can help identify developing bearing or imbalance problems, while oil analysis can reveal contamination and wear. Thermography can support checks for abnormal motor heating, and ultrasound can help detect issues such as compressed-air leaks or bearing lubrication problems. The right technique depends on the asset, the failure mechanism, and whether the team needs periodic checks or continuous monitoring.
When a failure repeats, use root cause failure analysis to identify why it keeps returning. Apollo, 5-Why, and fault-tree methods help the team trace a failure from the observed symptom to contributing conditions, rather than treating the replaced component as the root cause. A centrifugal pump that repeatedly loses bearings may need a closer look at alignment, lubrication, piping strain, or operating conditions before the maintenance plan is changed.
Match the maintenance strategy to the risk
Reliability-centered maintenance (RCM) links asset functions and failure consequences to suitable maintenance tasks. Teams can use that analysis to optimize inspection and maintenance intervals rather than applying the same schedule to every asset. Spare-parts criticality ranking also matters: identifying which bearings, seals, motors, or gearbox components would delay restoration helps planners focus on parts that affect repair time.
For multi-asset systems, reliability block diagrams and availability modeling can clarify how component failures affect system operation. Forge Reliability provides reliability consulting and condition-monitoring programs that include vibration analysis, oil analysis, and failure analysis; each program should be tied to the plant's defined availability boundary. Practical OEE improvement depends on addressing the production losses the plant has agreed to measure, not just improving the appearance of a dashboard (OEE improvement).
A clear measure gives maintenance and operations a shared basis for action. Teams can prioritize recurring unplanned downtime, improve repair readiness, and track whether corrective work changes the failure pattern, while keeping the denominator and event rules stable.
Forge Reliability offers a free reliability assessment to help identify how equipment failures, repair delays, and event coding affect availability reporting. Visit Forge Reliability to discuss the plant's critical assets and identify practical opportunities to improve uptime.