
A food processing plant has a centrifugal pump that keeps eating bearings. The team replaces the bearing, checks alignment, restarts, and gets a few more months before the same failure returns. Production loses uptime, maintenance loses credibility, and finance sees the same spend repeating with no permanent fix.
That pattern shows up in pumps, gearboxes, motors, and compressors across plants. The problem usually isn't a lack of effort. It's that the investigation stops at the failed component instead of tracing the conditions that made the failure possible. A bearing failure is rarely the cause. It's usually the result of something upstream.
That's where cause and effect maps earn their place. Used correctly, they help a cross-functional team organize what could have caused the failure, separate symptoms from mechanisms, and decide what needs to be tested on the plant floor. Used poorly, they turn into a whiteboard full of guesses that nobody validates.
When a team needs a cleaner way to document the sequence of events before building the map, a structured free post mortem template can help capture timeline, impact, and early observations. The larger reliability issue is still the same. Recurring failures need a method that goes deeper than “replace and watch.” Plants that want durable results usually pair this kind of investigation with broader work on maintenance cost reduction strategies, because repeat failures are almost always a cost problem before they're recognized as an analysis problem.
Table of Contents
- The Recurring Failure That Drains Your Budget
- What Is a Cause and Effect Map?
- Choosing Your Analysis Tool Fishbone vs Fault Tree
- How to Build a Map for a Centrifugal Pump Failure
- Integrating Diagnostic Data into Your Analysis
- Common Pitfalls and Best Practices in RCA Mapping
- From Diagram to Actionable Reliability Improvements
The Recurring Failure That Drains Your Budget
A common version of this problem looks like this. Pump P-101 in a food plant fails on a repeating cycle. The outboard bearing runs hot, vibration rises, the pump gets noisy, and maintenance swaps the bearing during an unplanned outage. The pump comes back, but the failure keeps returning.
The team has already checked the obvious items. Alignment was corrected. The bearing was replaced with the right part number. Grease was added on schedule. None of that changed the pattern. That's the moment when the plant has to stop treating the event as a single repair and start treating it as a system problem.
Surface fixes feel productive, but they don't close the case
A repeated component change can hide several different failure paths:
- Mechanical contributors that were never verified, such as pipe strain, soft foot, base looseness, or shaft imbalance.
- Lubrication problems including wrong lubricant, contamination ingress, overgreasing, or regreasing method issues.
- Operational stressors such as running too far from best efficiency point, intermittent dry running, or suction instability.
- Measurement blind spots where the team doesn't trust the temperature gun, vibration route, or inspection history enough to compare events.
Practical rule: If the same asset fails again after the obvious correction, the earlier diagnosis was incomplete.
Cause and effect maps work well here because they force the team to lay out all plausible contributors in one place. Instead of arguing whether misalignment or lubrication caused the damage, the team can put both on the map, break each one down, and decide what evidence would confirm or reject each branch.
The payoff isn't the diagram itself. The payoff is that the team stops making repairs based on confidence and starts making them based on verified cause.
What Is a Cause and Effect Map?
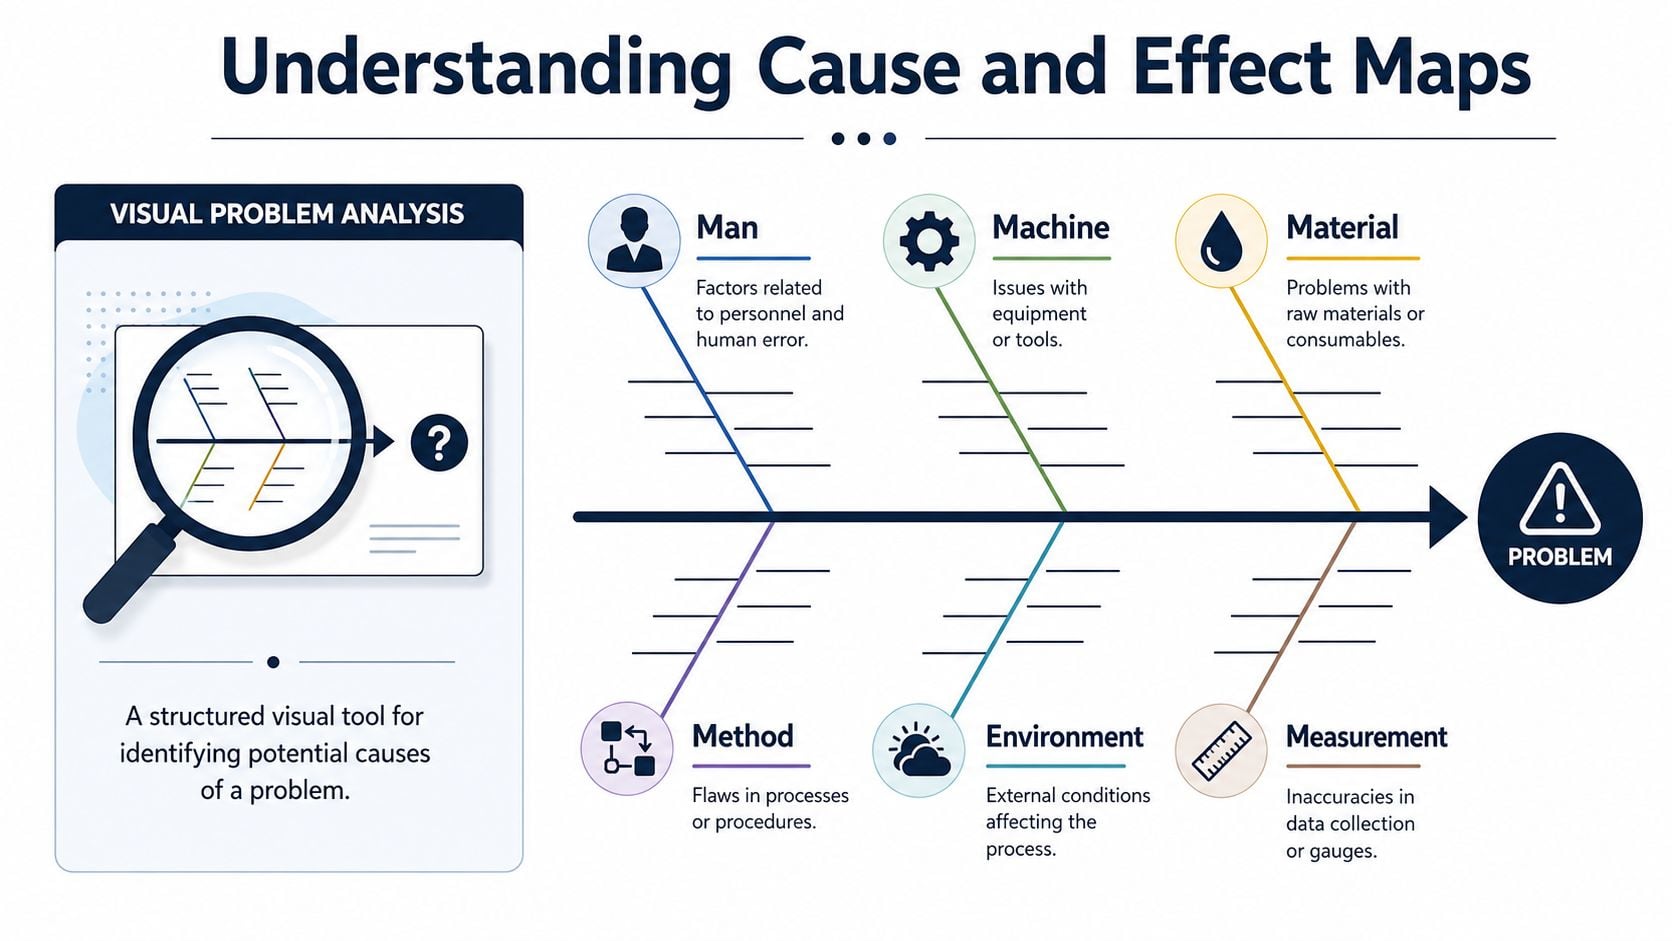
A cause and effect map is a visual way to organize possible causes of a defined problem. In quality and reliability work, it's often called a fishbone or Ishikawa diagram. The method was created by Kaoru Ishikawa in the 1960s and became one of the seven basic quality tools. It's commonly organized around the classic 6M categories of man, machine, method, material, measurement, and milieu or environment, with some practitioners adding another M for more complex problems, as described by the Juran guide to cause-and-effect diagrams.
The map is a sorting tool, not a verdict
A lot of teams misuse the fishbone because they expect it to produce the answer in the meeting. It won't. The map organizes possible causes so the team can test them in a disciplined way. That distinction matters in plant failure analysis because a workshop can generate a long list of ideas very quickly, but only inspection and data can tell the team which branch drove the event.
A good mental model is an investigation board, not a conclusion board. The “head” of the fish is the effect being investigated. The large bones are broad categories of possible causes. The smaller bones are specific mechanisms, conditions, or errors under each category.
How the 6M structure works in a plant
In industrial reliability, the 6M framework keeps the discussion from collapsing into “maintenance missed something.”
- Man covers human factors such as training, procedure adherence, handoff quality, and decision-making during alarms or startups.
- Machine captures equipment condition. Think bearing fits, coupling condition, shaft runout, looseness, seal health, or base integrity.
- Method covers work process. Lubrication routes, installation standards, alignment procedure, startup sequence, and PM scope belong here.
- Material includes lubricant type, contamination, spare quality, seal material, process fluid properties, and consumables.
- Measurement asks whether the plant measured the condition correctly. Bad sensor placement, drifted instruments, missing routes, and poor baseline data fit here.
- Milieu or environment includes washdown exposure, ambient heat, dust, humidity, corrosives, vibration from adjacent equipment, and process upset conditions.
A strong map doesn't prove a cause. It prevents the team from ignoring one.
That structure is especially useful for rotating equipment. A gearbox with high temperature may have machine issues, but it may also have a method problem such as an incorrect oil fill practice, or an environment problem such as airborne contamination entering through a damaged breather. Teams that need a more logic-driven event model often move next into fault tree analysis examples when they need to evaluate failure paths in more detail.
Choosing Your Analysis Tool Fishbone vs Fault Tree
Reliability teams often treat fishbone diagrams and fault trees as interchangeable. They aren't. Both are useful, but they answer different questions and demand different levels of evidence.
A fishbone is usually the better starting point when the plant has a recurring equipment problem and needs to explore a wide field of possible contributors. A fault tree is more useful when the team has a high-consequence top event and needs to model the combinations of events that could produce it.
When a fishbone is the better starting point
Take a gearbox on a packaging line with recurring high vibration and high temperature. The plant knows the gearbox is a chronic issue, but not whether the driver is lubrication, loading, mounting, alignment, operator practice, or process cycling. A fishbone gives the team breadth first. It helps maintenance, operations, and engineering put all credible branches on one page before anyone starts defending a favorite theory.
That makes it practical for chronic reliability problems where the first challenge is framing the problem correctly.
When fault tree earns the extra effort
Now consider a reactor feed system where loss of pump function can create a severe process upset. In that case, the team may need a top-down model of event combinations, dependencies, and critical failure paths. Fault tree analysis is built for that kind of logic. It's less about open brainstorming and more about structured deduction.
Teams that work in high-risk environments also use fault tree thinking alongside failure mode and effects analysis in maintenance planning because the two methods complement each other. One explores how a system can fail. The other helps prioritize the effects and controls.
Fishbone Diagram vs. Fault Tree Analysis (FTA)
| Criterion | Fishbone (Ishikawa) Diagram | Fault Tree Analysis (FTA) |
|---|---|---|
| Primary purpose | Organizes possible causes of a problem | Models the logic that leads to a defined top event |
| Best use case | Recurring failures, broad team investigation, early-stage RCA | High-consequence failures, risk logic, event dependency analysis |
| Direction of thinking | Broad brainstorming around categories | Top-down deductive logic |
| Output | List of plausible causes to test | Structured event tree showing combinations and dependencies |
| Team value | Strong for workshop participation and cross-functional input | Strong for engineering review of critical scenarios |
| Weakness | Can stay vague if nobody validates branches | Can become too complex for routine chronic equipment issues |
The practical trade-off is simple. If the team doesn't yet know what to test, start with a fishbone. If the team already knows the top event and needs rigorous event logic, build a fault tree.
How to Build a Map for a Centrifugal Pump Failure
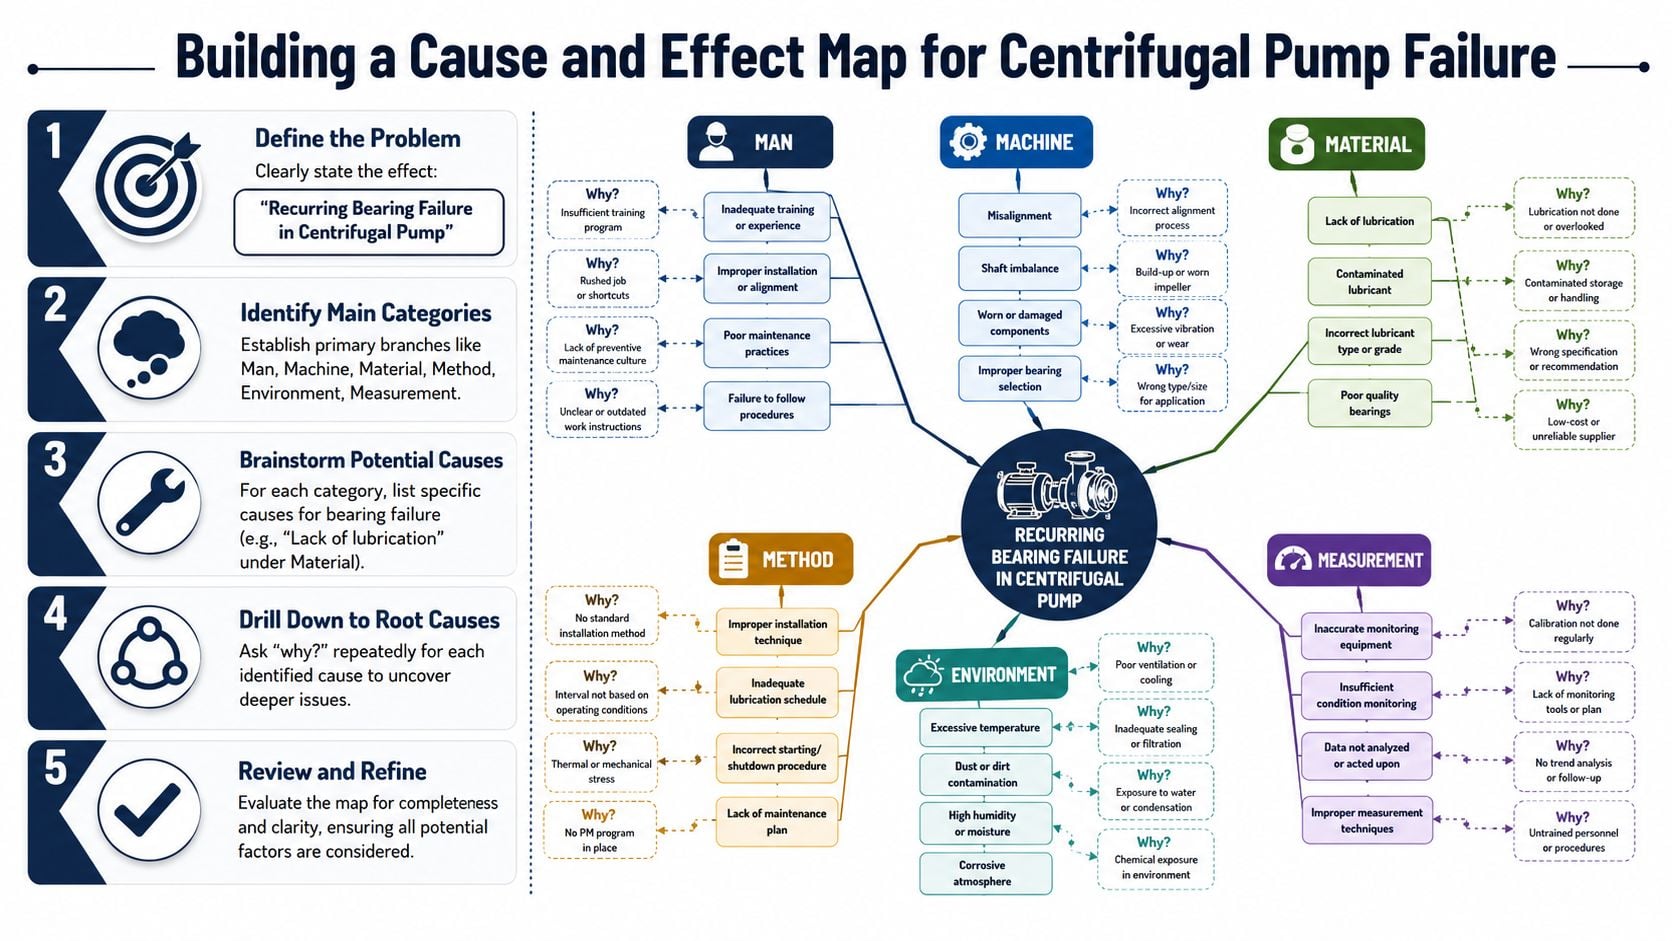
A cause and effect map only helps if the problem statement is sharp. In industrial reliability work, the method is stronger when the effect is measurable and evidence-based, and when suspected causes are validated against real plant data rather than assumptions, as outlined in this guidance on cause-effect diagrams.
Start with a measurable effect
Don't write “pump is failing.” Write something the team can investigate.
A better effect statement is: Pump P-101 outboard bearing shows repeated overheating and premature failure during normal production service. That statement gives the team an asset, a component, a symptom, and an operating context.
The more measurable version is even better if the plant has history. It ties the map to work orders, temperature readings, vibration trends, lubrication records, and operating log entries.
Build branches that can be tested
Once the effect is defined, the team draws the head and spine of the fish and adds the main categories. For a centrifugal pump, the early branches often look like this:
Machine
Misalignment, imbalance, bent shaft, soft foot, looseness, bearing fit issues, seal drag, pipe strain.Method
Incorrect installation sequence, poor alignment process, weak lubrication practice, startup with closed discharge, skipped acceptance checks.Material
Wrong grease, incompatible grease mix, dirty lubricant, low-quality spare, seal material mismatch with the process fluid.Measurement
Temperature readings from the wrong location, vibration route gaps, unreliable baseline, no confirmation after repair.Environment
Washdown intrusion, high ambient temperature, chemical exposure, vibration transmitted from nearby equipment.Man
Incomplete training, inconsistent regreasing practice, poor shift handoff, alarm response that changes operating conditions.
Push each branch until it becomes actionable
Weak RCAs usually stop too early. “Operator error” is not a useful endpoint. “Poor lubrication” is still too broad. Each branch needs to be pushed down until it becomes specific enough to inspect, measure, or correct.
For example:
- Bearing overheating
- Why did the bearing overheat?
- Lubricant film broke down
- Why did the film break down?
- Grease was contaminated with water
- Why was water entering the housing?
- Washdown spray was reaching a damaged bearing isolator
That final branch is something the team can verify on the pump.
If a branch can't be tested, it's not ready to drive a corrective action.
A useful discipline is to put expected evidence next to each branch. Misalignment should show up in coupling condition, soft foot checks, and vibration behavior. Lubrication issues should show up in grease condition, internal inspection, and housing cleanliness. Pipe strain should show up during uncoupled movement or flange release observations.
For teams working on this exact asset class, a more equipment-specific reference on root cause analysis for centrifugal pumps can help frame likely failure paths and verification steps.
Integrating Diagnostic Data into Your Analysis
Most fishbone diagrams fail for one reason. The team never graduates from possible causes to probable causes. A workshop generates ideas, but the map only becomes useful when condition data starts removing weak branches.

Use condition data to eliminate weak branches
In a pump or motor investigation, each suspected cause should point to a diagnostic path.
If the map includes misalignment, the team should review vibration behavior, coupling inspection, alignment records, and base condition. If the map includes lubricant contamination, the evidence should come from oil or grease condition, ingress points, seal condition, and housing cleanliness. If the effect includes overheating, thermal inspection should determine where the heat is concentrated and whether the pattern matches friction, electrical issues, process temperature, or poor cooling.
A practical way to structure this is to convert each major branch into three questions:
- What evidence would support it
- What evidence would disprove it
- What field check can be done next shutdown or next route
That keeps the map tied to the plant floor. It also prevents the team from treating every plausible cause as equally likely.
The map should narrow the search, not multiply speculation.
In rotating equipment, this evidence often comes from vibration, oil analysis, thermography, ultrasound, motor current review, operator logs, and teardown findings. The exact tool matters less than the discipline. Every branch needs a validation path.
Map multi-factor failures with AND logic
Some failures don't happen because of one cause alone. Advanced cause maps can include AND logic when multiple causes are required to produce the effect. Investigators should ask what was required for the failure, not only what happened next, as explained in ThinkReliability's cause mapping method overview.
That matters in industrial reliability because many chronic failures are conditional. A gearbox may fail only when contamination and high load and degraded lubrication exist together. A motor bearing may fail when misalignment combines with soft foot and frequent starts. A pump seal issue may only appear when process upset and cavitation and flushing problems occur at the same time.
A simple linear chain misses that interaction.
Here's what a stronger map looks like in practice for the recurring pump example:
| Suspected branch | Evidence to check | Action if confirmed |
|---|---|---|
| Misalignment | Vibration pattern, coupling wear, alignment history, base checks | Correct alignment process and verify machine train condition |
| Water ingress | Seal condition, housing inspection, lubricant condition, washdown exposure | Improve sealing and isolate the housing from washdown |
| Pipe strain | Movement during loosened connection checks, installation review | Rework piping support and eliminate nozzle loading |
| AND condition of contamination plus high temperature plus poor regreasing | Combined review of lubricant condition, thermal pattern, and PM execution | Change procedure, training, and protection methods together |
Plants that already collect predictive data can use the map to decide which routes, alarms, and inspections need to change. Teams also connect this kind of logic to broader predictive programs, including machine learning approaches in predictive maintenance, when they want better prioritization of recurring failure patterns across many assets.
Common Pitfalls and Best Practices in RCA Mapping
Many RCA meetings fail before anyone notices. The whiteboard looks busy, the team feels engaged, and the final output still doesn't produce a better maintenance decision.
The problem usually isn't effort. It's poor discipline around scope, evidence, and follow-through.
The mistakes that weaken most maps
Some errors show up again and again in pump, motor, and gearbox investigations.
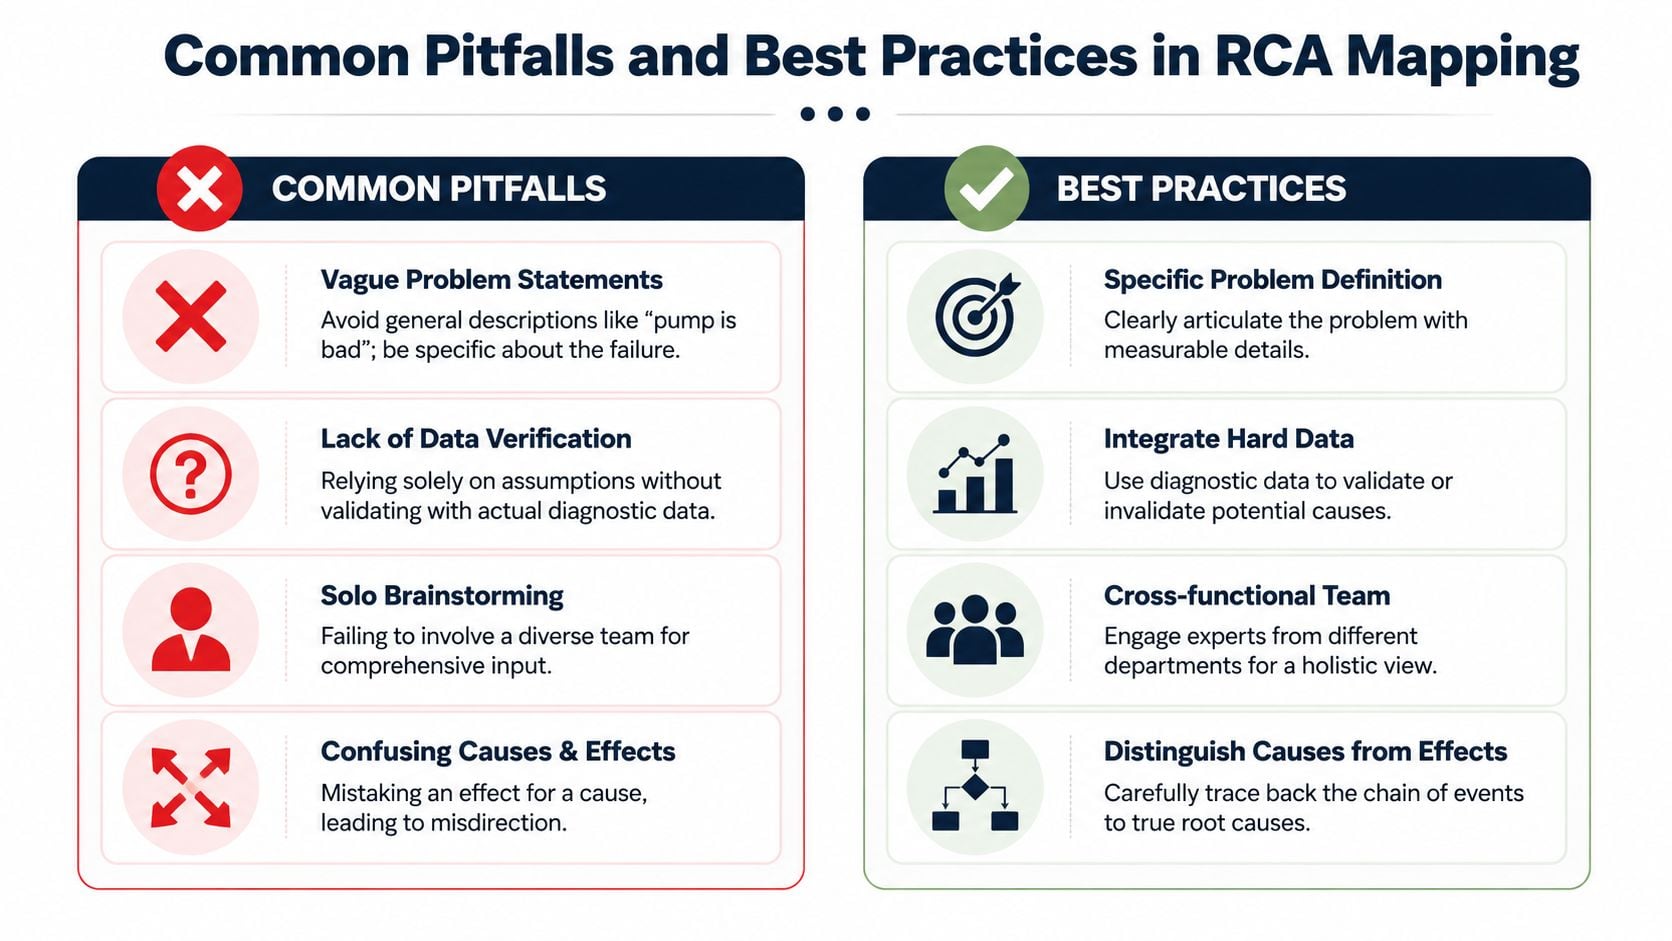
Vague effect statements
“Pump is bad” doesn't tell the team what failed, where, under what conditions, or how often.Stopping at the symptom
“Bearing failed” is only a component outcome. It says nothing about why the bearing failed.Blame-based endpoints
“Operator error” or “poor maintenance” often hides a missing standard, weak procedure, bad design, or inadequate verification step.Too much complexity too early
Some teams build giant maps that nobody can test. If the branches don't lead to evidence collection, the exercise becomes theater.
What better RCA teams do differently
Cause and effect maps are most effective when they're paired with the 5-Whys method to push beyond surface symptoms. The process is intentionally iterative, and teams may need to redraw the diagram after the first version so it stays clear, testable, and tied to an action plan with ownership, as noted in this review of iterative RCA practice.
That plays out in a few practical habits:
Define the failure like an engineer
State the asset, failed function, symptom, and operating context in terms the team can measure.Use a cross-functional room
Operations sees process changes. Maintenance sees repair quality. Reliability sees trends. The map gets stronger when all three are present.Separate evidence from opinion
Put teardown findings, inspection results, trend data, and operating history on the wall next to the map.Redraw when needed
A first draft is often cluttered. The second draft usually shows the actual path more clearly.
A clean second version is often more valuable than a crowded first version.
One practical option for teams that need structured support is Forge Reliability, which provides root cause failure analysis using methods such as 5-Why and fault tree logic for equipment investigations. The method matters less than the discipline. If the team won't verify branches and assign actions, the map won't change reliability.
From Diagram to Actionable Reliability Improvements
A cause and effect map is only useful if it changes what the plant does next week. The diagram should end with specific actions tied to the most credible failure branches, not a generic note to “monitor the pump.”
For a recurring centrifugal pump problem, that often means converting the final map into a short corrective plan:
- One engineering action such as eliminating pipe strain or upgrading sealing against washdown exposure.
- One maintenance action such as changing lubrication method, improving alignment verification, or adding an inspection point after rebuild.
- One operations action such as controlling startup conditions or avoiding damaging run states.
- One verification action such as checking vibration, temperature, lubricant condition, or teardown evidence after the fix.
Ownership matters. So do dates. So does verification. If nobody is named and no evidence is required afterward, the plant hasn't solved anything. It has only documented its frustration more neatly.
The strongest reliability teams use cause and effect maps as the front end of a disciplined loop. Define the effect. Map plausible causes. Test the branches. Confirm the most likely chain. Assign corrections. Verify that the failure pattern is gone. That's how reactive maintenance starts turning into repeatable reliability improvement.
A no-cost reliability assessment from Forge Reliability can help identify where recurring failures, weak diagnostics, or incomplete RCA practices are keeping critical assets in a reactive cycle. For plants dealing with chronic pump, motor, gearbox, or compressor problems, that assessment is a practical next step toward a data-backed action plan.